Figure 2.
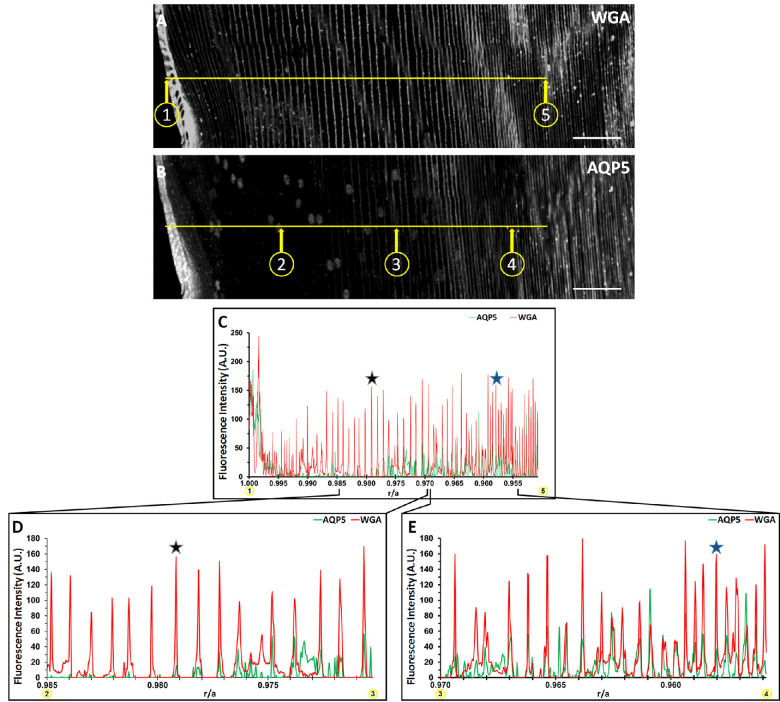
Cytoplasmic AQP5 is progressively inserted into cortical fiber plasma membranes during fiber cell differentiation in the bovine lens. (A) A grayscale image of Figure 1E with only WGA labeling displayed. Distinct points in space on a lens cryosection (n = 1) are represented by the quotient r/a, where r is the distance from any point to the center of the lens perpendicular to the optical axis, and a is the radius of the lens, which is 8000 µm for this section. Circled point 1 in C corresponds to r/a = 1.000, and circled point 5 corresponds to r/a = 0.950. The horizontal yellow line in C connects circled points 1 and 5. (B) A replicate, grayscale image of Figure 1E with only AQP5 immunolabeling displayed. The horizontal yellow line is collinear to the line in B and connects circled points 2, 3, and 4, which correspond to r/a = 0.985, r/a = 0.970, and r/a = 0.955, respectively. (C) Two-dimensional surface plots of the fluorescence-intensity gray values of WGA in B (red line) and AQP5 in D (green line) across the yellow line from circled points 1 to 5. (D) Two-dimensional surface plots of the fluorescence-intensity gray values of WGA in B (red line) and AQP5 in D (green line) across the yellow line from circled points 2 to 3. (E) Two-dimensional surface plots of the fluorescence intensity gray values of WGA in B (red line) and AQP5 in D (green line) across the yellow line from circled points 3 to 4. AQP5 fluorescence intensity maximizes at r/a = 0.998 then decreases rapidly to nearly undetectable levels at r/a = 0.989. AQP5 fluorescence intensity increases inversely with r/a and is partially overlapped in space by the fluorescence intensity of WGA from 0.979 (black star) ≥ r/a ≥ 0.958 (blue star) (D, E) AQP5 fluorescence intensity is entirely overlapped by that of WGA in space at r/a = 0.958 (blue star) (D). This trend continues to the lens center (0.958 ≥ r/a ≥ 0.000; data not shown). Scale bars: 100 µm (A, B).

