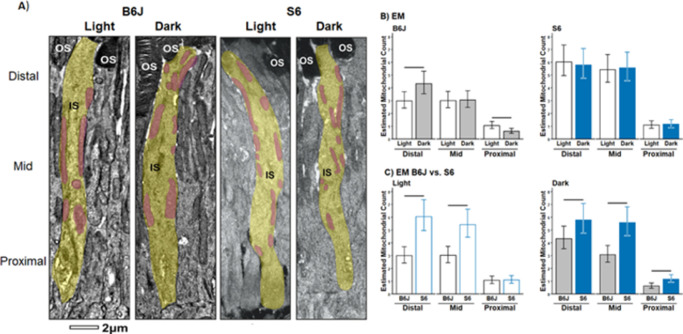
Figure 5.
B6J versus S6 mice rod inner segment ellipsoid mitochondria distribution and number measured by EM. (A) Electron microscopy images of representative rod inner segment ellipsoid (yellow) and mitochondria (purple) in one-hour light versus dark B6J (left two panels) versus S6 (right two panels) mice. The distal inner segment ellipsoid is identified by the presence of outer segments (OS). (B) Quantification of mitochondrial number within each third region-of-interest within the inner segment ellipsoid in light versus dark (top row) and between B6J (black bars) and S6 (blue bars) mice for each light condition (bottom row). Horizontal black line: P < 0.05, 95% confidence interval measured from light (n = 3/strain), dark (n = 3/strain), 15 inner segment ellipsoid/mouse/strain.

