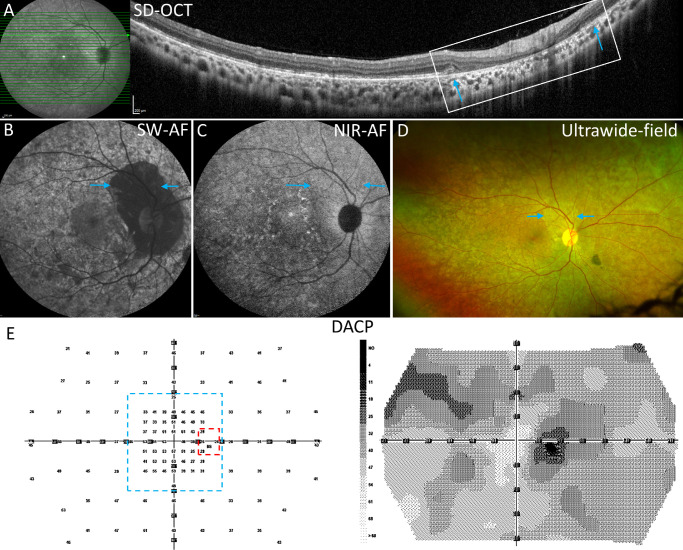
Figure 3.
Multimodal images and dark-adapted chromatic perimetry (DACP) P1. (A) SD-OCT scan through the zone of peripapillary atrophy. EZ band disruption is apparent temporally. Peripapillary zone is marked by outer retinal loss and hypertransmission of signal (white rectangle). The margins of atrophy (blue arrows) in the SD-OCT scan correspond spatially to the positions marked by blue arrows in B to D. The axis of the horizontal scan is shown as the green line in the near-infrared reflectance image on the left. (B) The SW-AF image reveals a mosaic of hypo- and hyperautofluorescence, extensive mottling, widespread peripapillary atrophy, and faint hyperautofluorescent speckles. (C) The NIR-AF shows a mosaic of hypo- and hyperautofluorescence patches, and perifoveal hyperautofluorescent speckles. (D) Ultrawide-field image reveals mosaicism in the peripheral retina. (E) DACP cyan field- numeric grid and grayscale map. The dashed lines indicate the subregions used for visual field analyses: red, the peripapillary area; and blue, the macular area.

