Figure 4.
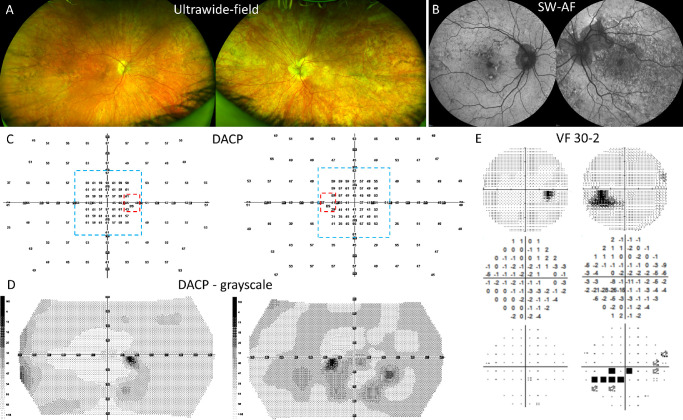
Multimodal images and dark-adapted chromatic perimetry (DACP) reveal asymmetry between the eyes P9. (A) Ultrawide-field images demonstrating pigmentary changes overlaying all visible retina (OS > OD). (B) SW-AF images demonstrate the asymmetry in terms of atrophy and autofluorescence mosaicism. (C) DACP cyan field numeric grid for right and left eyes with values in dBs. Areas delimited by dashed lines are the subregions used for sensitivity analyses: red marks the peripapillary area; and blue marks the macular area. (D) DACP grayscale map illustrating the asymmetry of scotopic sensitivity between the right and the left eyes. (E) The 30-2 visual fields for right and left eyes: grayscale, total deviation, and probability plots. The results for the right eye test are within normal limits. The grayscale plot for the left eye shows an enlarged blind spot (BS) and a scotoma below the BS which correlates spatially with the atrophy superior to the optic disc visible in panel B.

