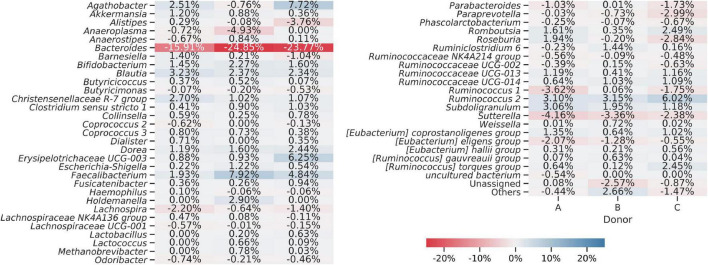
FIGURE 9.
Heat map showing differences in bacterial genera detected from amplicons prepared from the fresh and frozen stool. Averaged relative abundances from fresh samples were subtracted from results obtained for frozen samples, so negative values show that a certain genus was more abundant in fresh samples and positive values show that a genus was more abundant in frozen samples. The “Others” group summarizes genera with individual abundances lower than 0.5% in every sample. Sequences unassigned at the genus level were grouped and named “Unassigned.”

