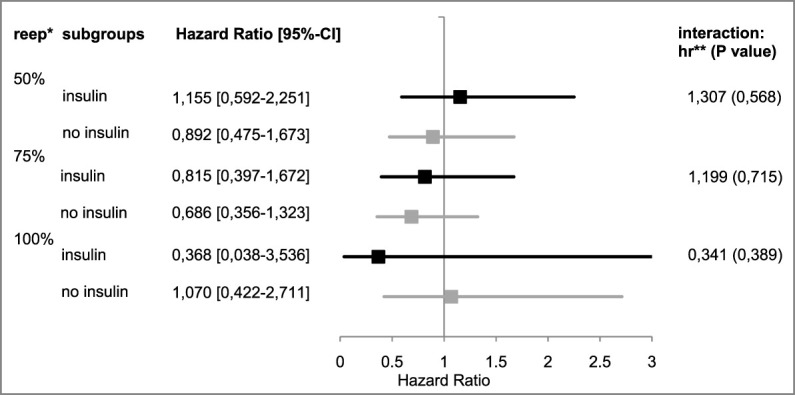
FIGURE 4.

Hazard ratios of “insulin” vs. “no insulin” subgroups. *re-ep, re-epithelialization level; ** hr, hazard ratio; represents the therapeutic effect of EPO with its 95%¬ confidence interval in the subgroup; and hr < 1 represents a negative therapeutic effect in the patients receiving EPO; the respective interaction effects are listed on the right.
