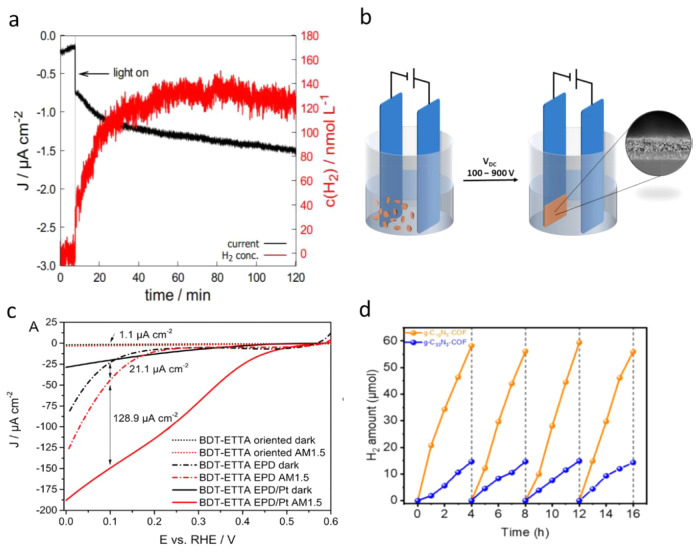
Figure 9.
(a) Hydrogen evolution on a BDT-ETTA COF electrode was quantified with a hydrogen microsensor (Unisense A/S H2-NPLR) with a selective silicone membrane at a static potential of 0.4 V vs RHE. Illumination of the sample with AM1.5 simulated sunlight results in a photocurrent (black) and the production of hydrogen (red). Adapted from ref (132). Copyright 2018 American Chemical Society. (b) Schematic presentation of the EPD setup with a typical COF film SEM cross-section. (c) Dynamic hydrogen evolution measurement under chopped AM1.5G illumination of a BDT-ETTA COF electrode at 0.2 V vs RHE. Adapted from ref (133). Copyright 2019 American Chemical Society. (d) Time course hydrogen evolution using g-C18N3-COF and g-C33N3-COF as catalysts under visible light (λ > 420 nm) irradiation, monitored over 16 h with evacuation every 4 h (dashed line). Adapted from ref (134). Copyright 2019 American Chemical Society.

