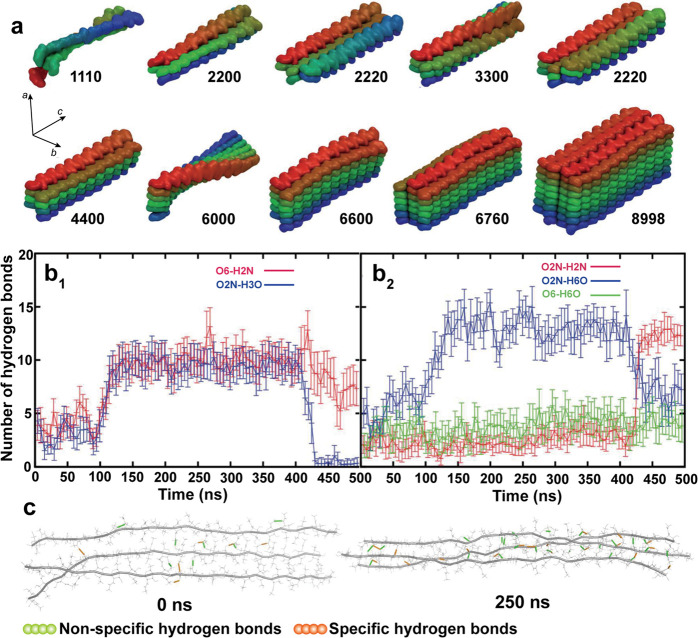
Figure 20.
(a) Schematic illustration of average structures of simulated chitin nanofibril systems using color-coded building blocks to highlight structural features. The number of nonzero digits in the name is the number of chitin chains in the ab plane, whereas the numeral at a given position is the number of chains in the corresponding ac plane. Number of (b1) nonspecific and (b2) specific H-bonds emerging during simulation using the (1110) model. Lines represent running averages over 5 ns time intervals, and vertical bars are variances in the same time interval. (c) Selected structures of the (1110) system observed at 0 (left panel) and 250 ns (right panel) during the MD simulations with highlighted H-bonding. Nonspecific H-bonding shows green and specific ones show orange. The chain backbones are shown as gray tubes. Adapted with permission from ref (316). Copyright 2016 The Royal Society of Chemistry.

