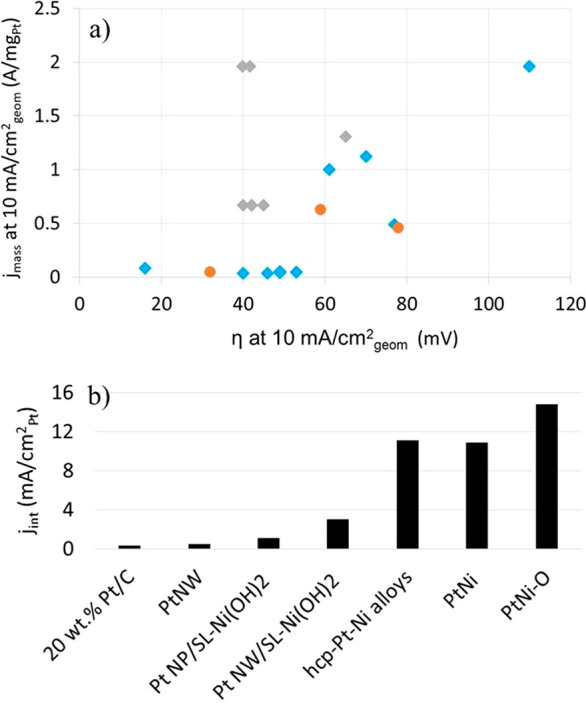
Figure 12.

(a) Mass current activities per amount of Pt versus the corresponding η for various Pt–Ni catalysts, both measured at 10 mA/cmgeom2. (b) Plot of the intrinsic activity per ECSA of Pt (jint) measured at η = 70 mV for two Pt-based and a number of Pt–Ni-based catalysts. The data used for (a) and (b) are shown in Tables S2 and S3, respectively. The blue diamonds represent Pt/C, the gray diamonds represent PtxNiy alloys, and the orange circles represent the Pt nanosized catalysts wih Ni(OH) in (a).
