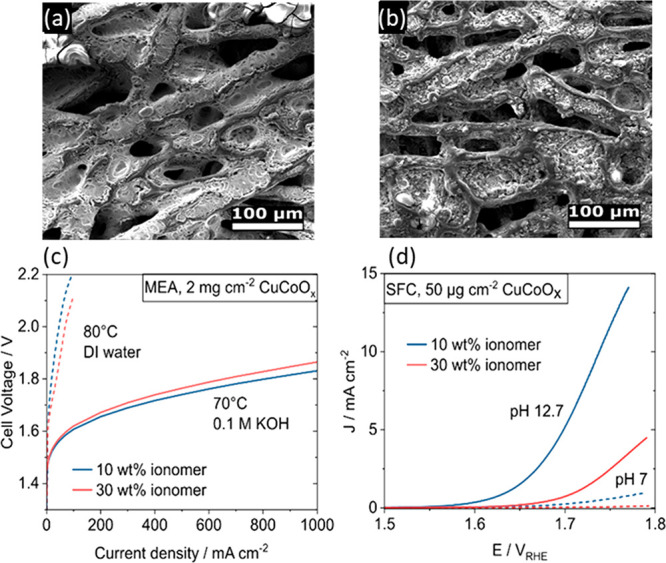
Figure 39.

SEM images of 2 mg/cm2 CuCoOx anode catalyst layers with (a) 10 wt % and (b) 30 wt % ionomer loadings.404 (c) Polarization curves of the single AEMWE cells for pure water (dashed lines) and for 0.1 M KOH (solid lines) feed. (d) iR-corrected linear sweep voltammograms of the CuCoOx anode catalyst layers with varying ionomer contents at pH 12.7 (solid) and pH 7 (dashed) of a 0.05 M phosphate buffer solution in a scanning-flow-cell measurement. A Pt loading of 0.5 mg/cm2 was used at the cathode. (c, d) Reprinted with permission from ref (403). Copyright 2022 Elsevier.
