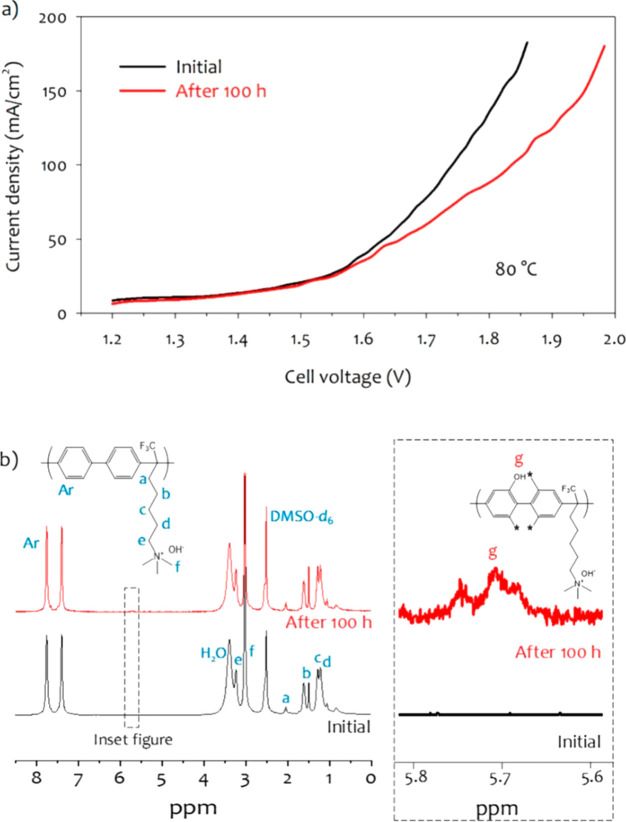
Figure 42.
(a) Polarization curves of an AEM water electrolyzer before and after the 100 h test at 2.1 V at 80 °C. (b) 1H NMR spectra of the anode AEI before and after the durability test. The inset in (b) is the expanded view of the oxidized phenol peak in the 1H NMR spectra; * denotes other expected oxidation sites. Adapted with permission from ref (415). Copyright 2019 American Chemical Society.

