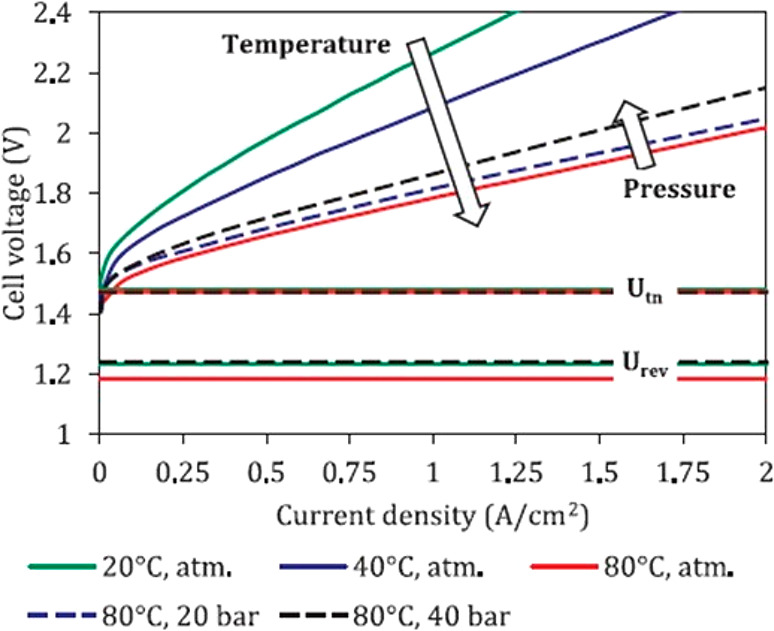
Figure 6.

Cell voltage (Ecell)–curve as a function of the applied current density for a PEMWE. The influences of T and P are shown. The thermoneutral voltage of 1.48 V, labeled as Utn, and the reversible voltage of 1.23 V, labeled as Urev, are also shown. Reprinted with permission from ref (24). Copyright 2018 Elsevier.
