
FIGURE 3.
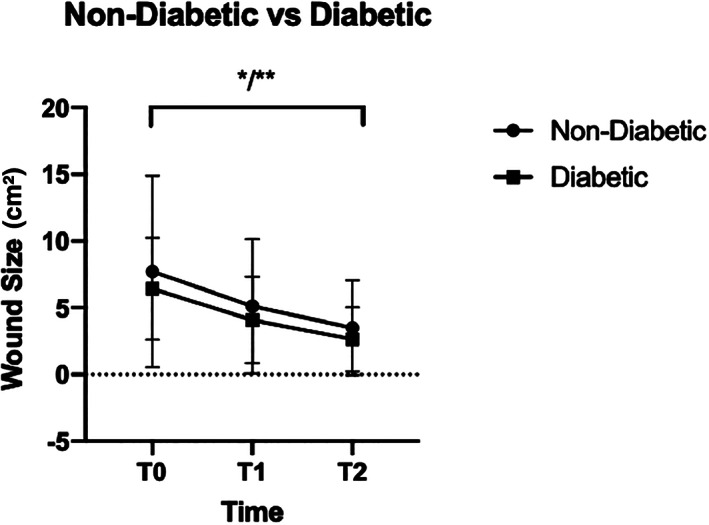
Comparison of the wound size in non‐diabetic vs diabetic wounds indicated as mean and standard deviation. T0 is the day of inclusion, T1 is after 4 weeks and T2 is after 8 weeks, ns, not significant
Official websites use .gov
A
.gov website belongs to an official
government organization in the United States.
Secure .gov websites use HTTPS
A lock (
) or https:// means you've safely
connected to the .gov website. Share sensitive
information only on official, secure websites.
Comparison of the wound size in non‐diabetic vs diabetic wounds indicated as mean and standard deviation. T0 is the day of inclusion, T1 is after 4 weeks and T2 is after 8 weeks, ns, not significant