
FIGURE 2.
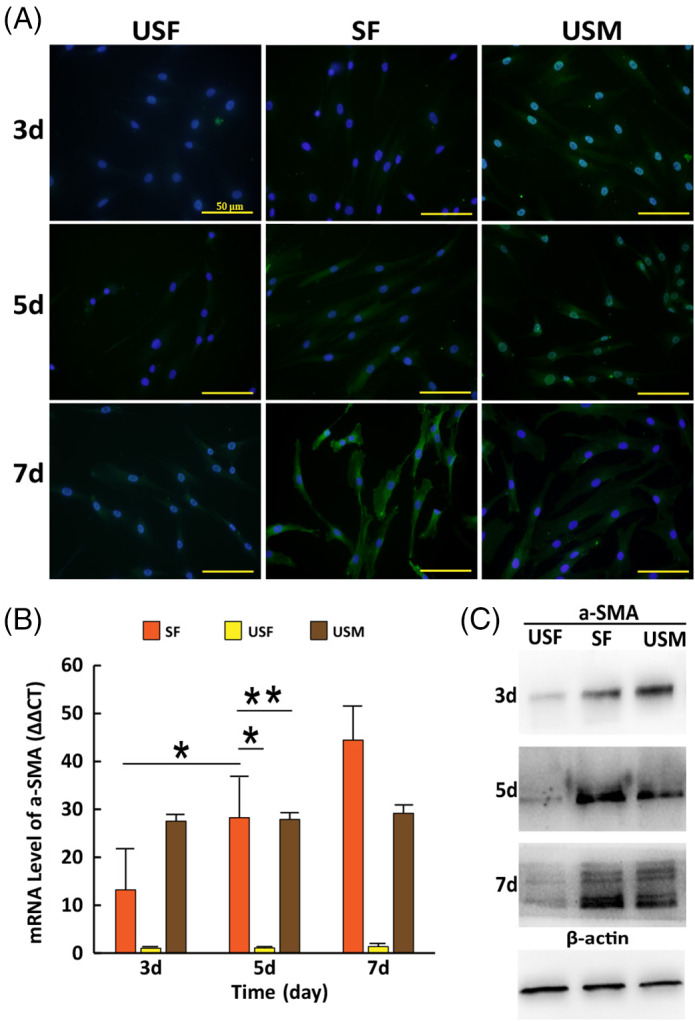
Detection of α‐SMA expression in cells at different time. (A) α‐SMA expression (Green) and nuclei staining (Blue) detected by immunofluorescence assay. Scale bars: 50 μm. (B) The mRNA expression levels of α‐SMA detected by RT‐PCR. (C) The protein levels of α‐SMA detected by western blotting. (i) SF: stretched fibroblasts; (ii) USF: unstretched fibroblasts; (iii) USM: unstretched myofibroblasts. Error bar: ±SD (n = 3); *P < 0.05; **P > 0.05