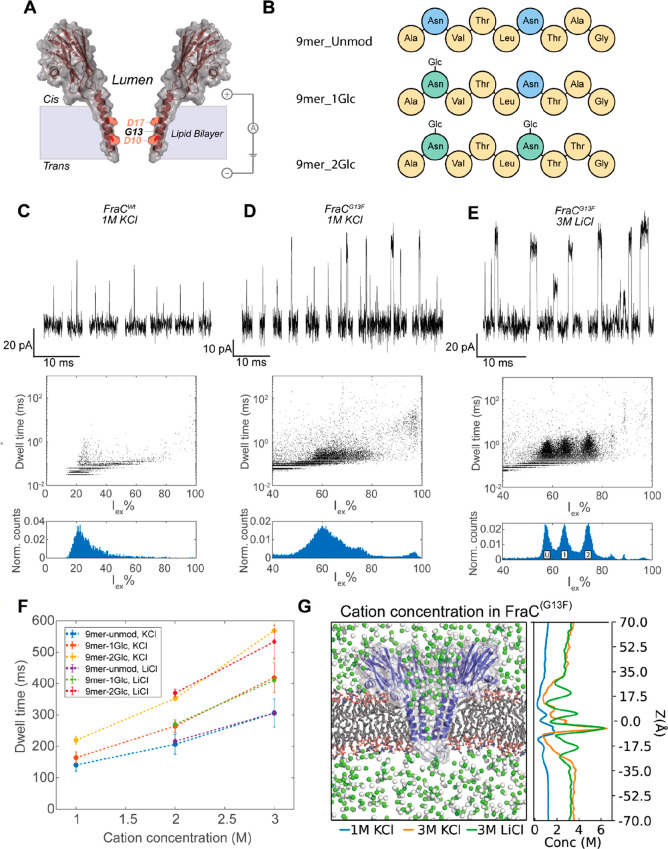
Figure 1.
Detection of glycopeptides in FraC nanopores. (A) Schematic representation of a FraC monomer. The lumen-facing residues in the constriction of the pore are indicated. (B) Schematic representation of the composition of the peptides used. (C–E) Representative events (top), dwell time versus excluded current (middle) and excluded current histogram (bottom) of an equimolar mixture of 9mer_unmod, 9mer_1Glc, and 9mer_2Glc measured in (C) FraCWt in 1 M KCl and 10 μM peptide mixture, (D) FraCG13F in 1 M KCl and 2.5 μM peptide mixture, (E) FraCG13F in 3 M LiCl and 5 μM peptide mixture. The location of peaks in the histogram belonging to 9mer_unmod (U), 9mer_1Glc (1), and 9mer_2Glc (2) are indicated. Data were recorded at 50 kHz sampling frequency, with a 10 kHz Bessel filter at pH 3.8. (F) Dwell time of the glycopeptides in buffers with varying salt concentrations. (G) The left panel shows a cut through of a MD simulation of a FraCG13F nanopore (blue) in a lipid bilayer (gray) in the presence of 3 M concentration of potassium (green) and chloride (white) ions at pH 3.8. The right panel shows the cation concentration along the z-axis averaged over 20 ns of MD simulation trajectory under a −50 mV potential.

