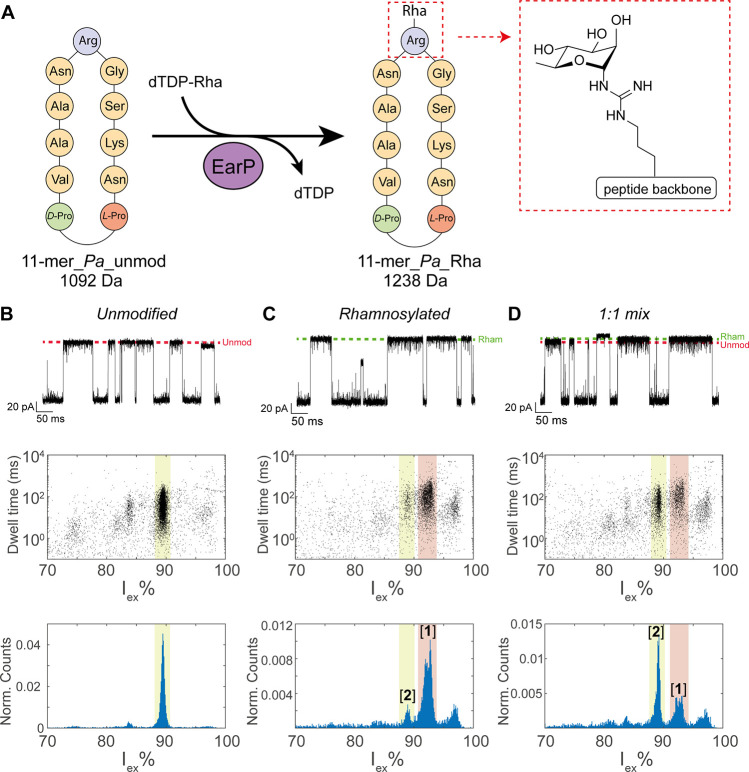
Figure 2.
Nanopore detection of rhamnosylation in cyclic peptides. (A) Schematic representation of the cyclic peptides before and after the rhamnosylation reaction. (B–D) Characteristic events (top), dwell time versus excluded current (middle), and excluded current histogram (bottom) of (B) 2.5 μM 11-mer_Pa_unmod, (C) 2.5 μM 11-mer_Pa_Rha, and (D) their 1:1 mixture in a final concentration of 2.5 μM. The dotted lines indicate the approximate ionic current levels of the unmodified (red) and rhamnosylated (green) peptide. The locations of event cluster [1] and cluster [2] are highlighted in red and yellow, respectively. Measurements in 3 M LiCl and 50 mM citric acid buffered to pH 3.8 under an applied voltage of −50 mV. Data were recorded at 50 kHz sampling frequency, with a 10 kHz Bessel filter.

