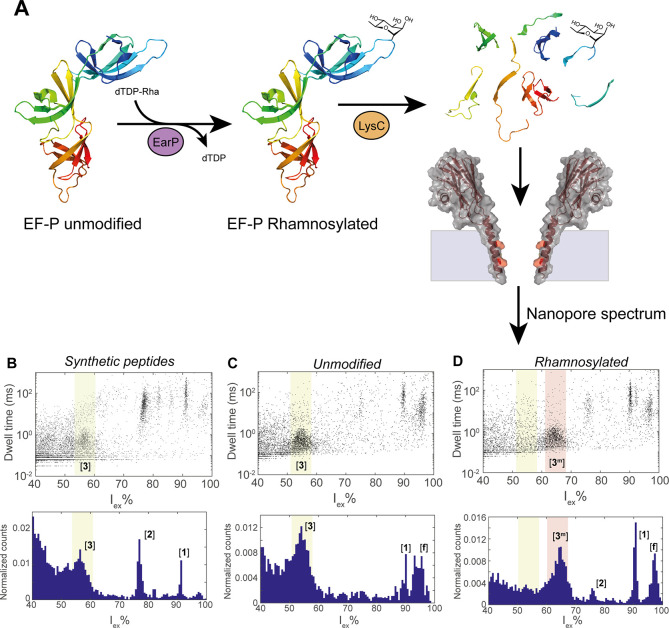
Figure 3.
Detection of rhamnosylation in EF-P. (A) Schematic representation of the rhamnosylation and subsequent LysC digestion of EF-P. (B) Event characteristics after the addition of a mixture of synthetic peptides ([1], [2], [3], and [4]). (C) Event characteristics after addition of Lys-C digested unmodified EF-P. (C) Event characteristics after addition of Lys-C digested rhamnosylated EF-P. The location of the event clusters [f], [1], [2], [3], and [3m] are indicated in the Iex% histogram, and the event clusters belonging to peptide [3] and [3m] are highlighted in yellow and red, respectively. Measurements in 3 M LiCl, buffered to pH 3.8, at −50 mV applied voltage. Data were recorded with a 50 kHz sampling frequency and a 10 kHz Bessel filter.

