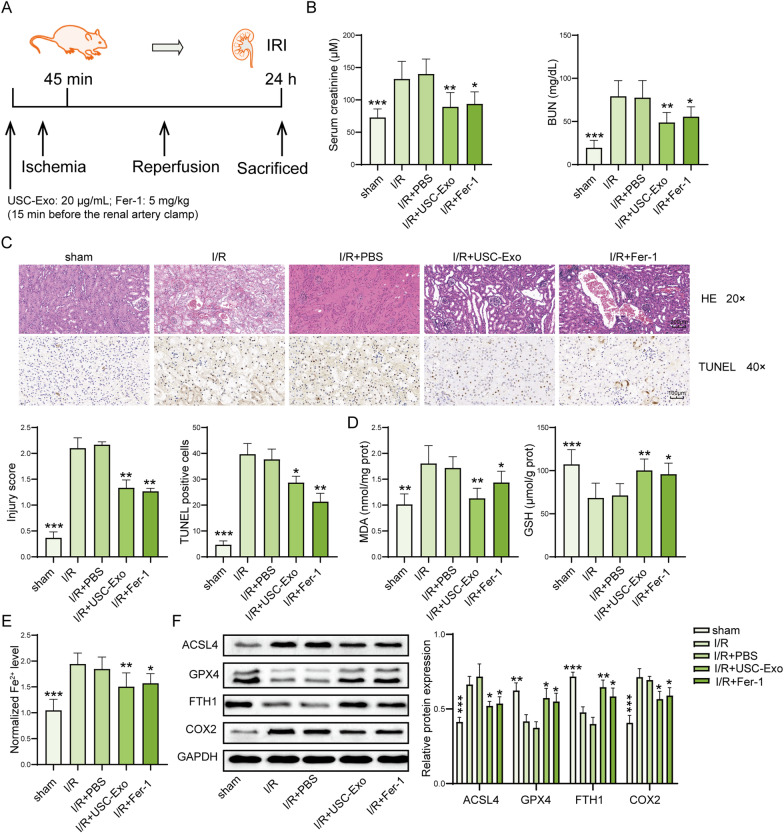
Fig. 4.
USC-Exo ameliorate ferroptosis in IRI-induced AKI. A Diagram of IRI-AKI model and treatment. B Serum levels of creatinine and BUN were assessed by colorimetric method. C The injury and cell death of kidney tissues showed by H&E dyes and TUNEL assay. Representative images of kidney H&E dyes and TUNEL staining were presented, and the kidney injury score and TUNEL-positive cell quantitative bar diagrams are shown. H&E, scale bar: 200 µm; TUNEL, scale bar: 100 µm. D The levels of MDA and GSH in the kidney tissues were measured by commercial kits. E The levels of Fe2+ in in the kidney tissues of mice were assessed by commercial kits. F The protein levels of ACSL4, GPX4, FTH1, and COX2 in the kidney tissues were assessed by western blot and shown as blot image and quantitative bar diagram. N = 6 mice per groups. *p < 0.05, **p < 0.01, ***p < 0.001 versus I/R group. The above data were all measurement data and expressed as means ± SD. All experiment was performed three times

