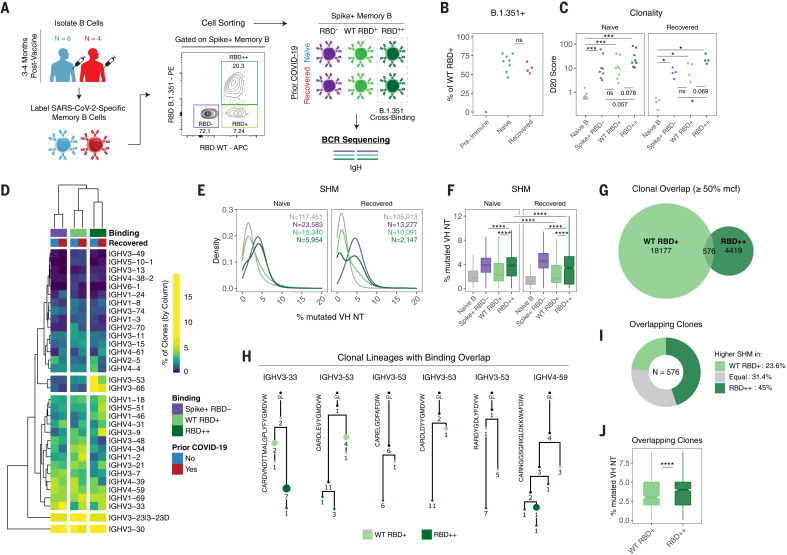
Fig. 4. Variant-binding memory B cell clones use distinct VH genes and evolve through somatic hypermutation.
(A) Experimental design for sorting and sequencing SARS-CoV-2–specific memory B cells. (B) Frequency of RBD++ (B.1.351 variant cross-binding) memory B cells as a percentage of total RBD+ cells. (C) Percentage of sequence copies occupied by the top 20 ranked clones (D20) across naïve B cells and different antigen-binding memory B cell populations. (D) Heatmap and hierarchical clustering of VH gene usage frequencies in memory B cell clones across different antigen-binding populations. Data are represented as the percentage of clones with the indicated VH gene per column. (E and F) Somatic hypermutation (SHM) density plots (E) and boxplots of individual clones across naïve B cells and different antigen-binding memory B cell populations (F). Data are represented as the percent of mutated VH nucleotides. Number of clones sampled for each population is indicated. For (C) to (F), data were filtered on clones with productive rearrangements and ≥2 copies. (G) Venn diagram of clonal lineages that are shared between WT RBD and RBD cross-binding (RBD++) populations. Data were filtered on the basis of larger clones with ≥50% mean copy number frequency (mcf) in each sequencing library. (H) Example lineage trees of clones with overlapping binding to WT and B.1.351 variant RBD. VH genes and CDR3 sequences are indicated. Numbers refer to mutations compared with the preceding vertical node. Colors indicate binding specificity, black dots indicate inferred nodes, and size is proportional to sequence copy number. GL, germline sequence. (I) Classification of SHM within overlapping clones. Each clone was defined as having higher (or equal) SHM in WT RBD binders or RBD++ cross-binders on the basis of average levels of SHM for all WT RBD versus RBD++ sequence variant copies within each lineage. (J) SHM levels within overlapping clones. Data are represented as the percentage of mutated VH nucleotides for WT RBD and RBD++ sequence copies. Statistics were calculated using unpaired nonparametric Wilcoxon test, with BH correction for multiple comparisons in (C) and (F). Notches on boxplots in (F) and (J) indicate a 95% confidence interval of the median. *P < 0.05; **P < 0.01; ***P < 0.001; ****P < 0.0001; ns, not significant.

