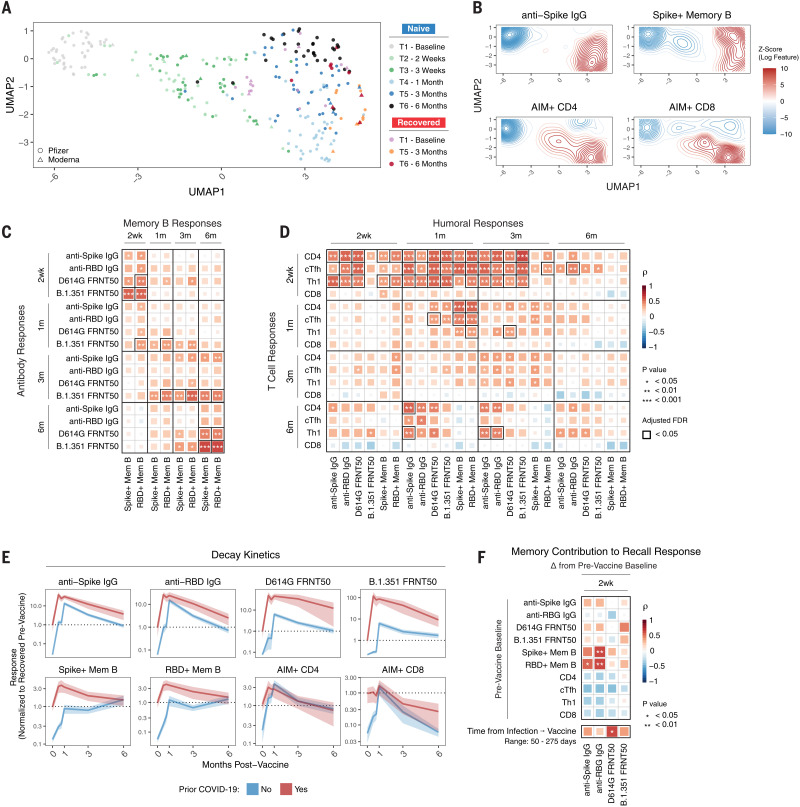
Fig. 6. Immune trajectories and relationships in response to SARS-CoV-2 mRNA vaccination.
(A) UMAP of 12 antigen-specific parameters of antibody, memory B, and memory T cell responses to mRNA vaccination in SARS-CoV-2–naïve and –recovered subjects. Data points represent individual participants and are colored by time point relative to primary vaccine. (B) Kernel density plots of anti-spike IgG, spike+ memory B, AIM CD4+, and AIM+ CD8+ T cells. Red contours represent areas of UMAP space that are enriched for specific immune components. (C) Correlation matrix of antibody and memory B cell responses over time in SARS-CoV-2–naïve subjects. (D) Correlation matrix of T cell and humoral responses over time in SARS-CoV-2–naïve subjects. (E) Decay kinetics of antibody, memory B cell, and memory T cell parameters over time in SARS-CoV-2–naïve and –recovered vaccinees. Data are normalized to prevaccine levels in SARS-CoV-2–recovered individuals to evaluate the effect of boosting preexisting immunity. Lines connect mean values at different time points, ribbons represent the 95% confidence interval of the mean, and dotted lines indicate mean values at baseline. (F) Correlation matrix of baseline memory components and time since infection with antibody recall responses after vaccination in SARS-CoV-2–recovered individuals. Recall responses were calculated as the difference between postvaccination levels and prevaccine baseline. All statistics were calculated using nonparametric Spearman rank correlation.

