Fig. 1.
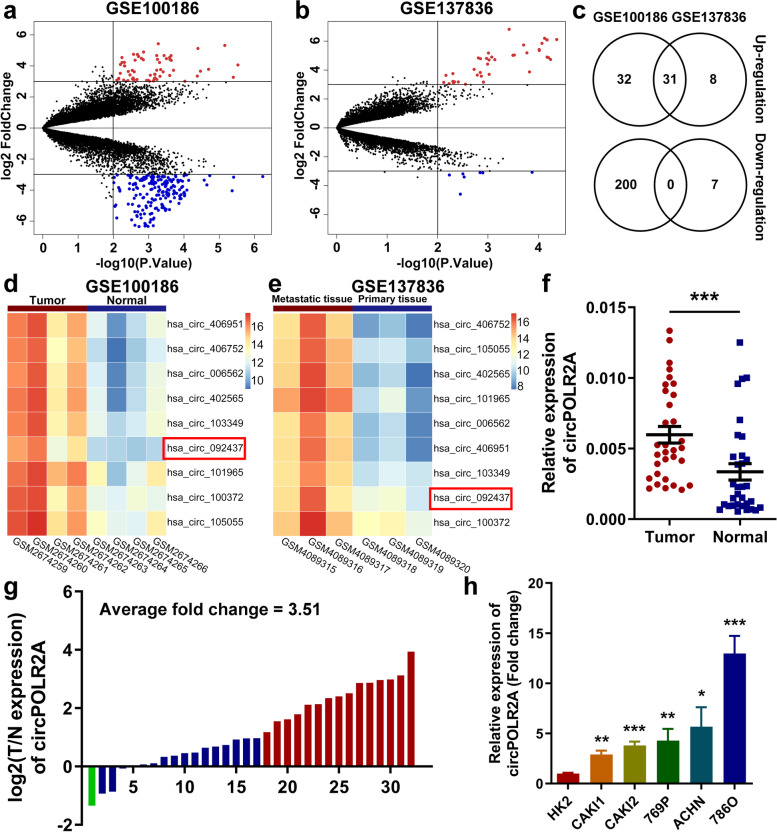
Profiling of dysregulated circRNAs and validation of aberrant expression of circPOLR2A in cRCC. a, b Volcano plots of GSE100186 (a) and GSE137836 (b). DE circRNAs were identified with p value < 0.01 and log2(Fold Change) > 3. The significantly upregulated circRNAs were expressed as red dots, while blue dots represented downregulated circRNAs. c Venn diagram of DE circRNAs in two datasets. d, e Heatmaps of 9 DE circRNAs with high expression in two datasets. f The expression of circPOLR2A in 32 paired tissues of cRCC. P values were evaluated by paired two-sided t test. g Expression ratio of circPOLR2A in 32 paired tissues of cRCC. Red, Log2 (T/N expression) value > 1; blue, 1 ≥ Log2 (T/N expression) value ≥ − 1; Green, Log2 (T/N expression) value < − 1. h CircPOLR2A expression was examined in HK2 and cRCC cells via qRT-PCR

