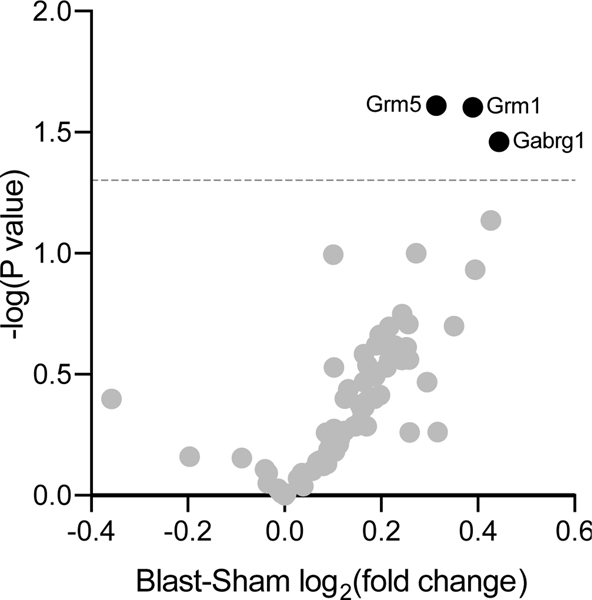
Figure 4: Expression of GABA- and Glutamate-related genes in OFC following mbTBI vs. sham exposure.
Presented here is a volcano plot of GABA and glutamate related gene expression from the OFC of blast rats relative to sham rats (n=6/group). Mean relative expression are plotted on the x-axis and corresponding p-values from t-test (sham vs blast) are plotted on the y-axis. Blast lead to significant increased expression of Grm1, Grm5, and Gabrg1 compared to sham (t-test p=0.0249, p=0.0246 and p=0.0346, respectively). Grm1 = Metabotropic Glutamate receptor 1, Grm5 = Metabotropic Glutamate receptor 5, and Gabrg1 = GABA A receptor gamma subunit 1.

