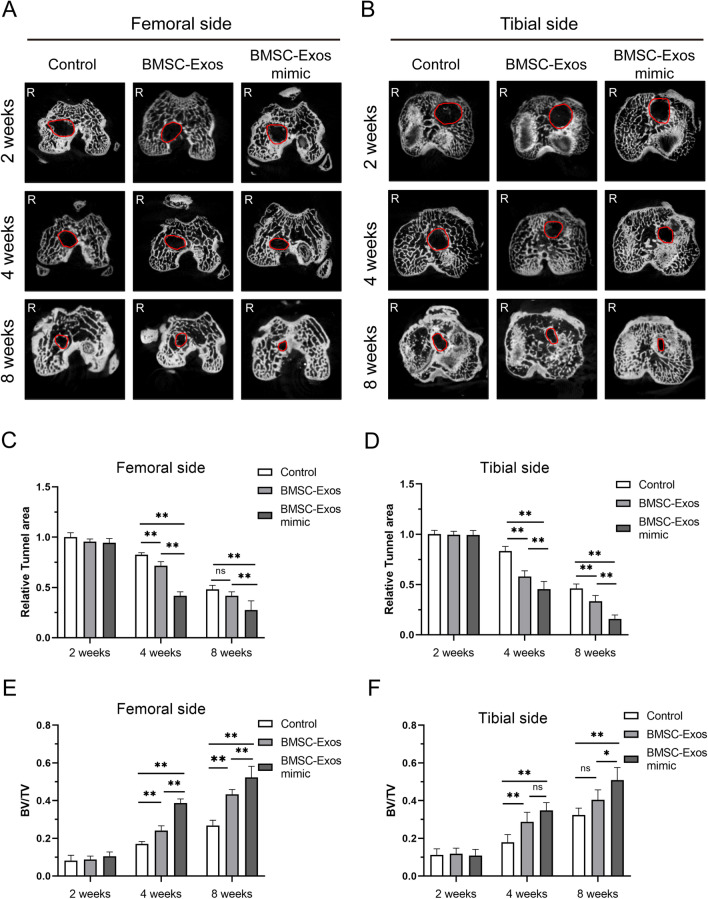
Fig. 6.
Micro-CT imaging analysis of the different groups at 2, 4, and 8 weeks postoperatively. The cross-sectional micro-CT images of the bone tunnel at the femoral side (A) and tibial side (B). Relative tunnel area at the femoral (C) and tibial (D) sides and the bone volume/total volume ratio (BV/TV) at the femoral (E) and tibial (F) sides for ACLR at 2, 4, and 8 weeks postoperatively among the control group, the BMSC-Exos group and the BMSC-Exos mimic group. Data are presented as mean ± SD. Statistical analysis was performed with one-way ANOVA followed by Tukey’s multiple comparisons test. n = 6. *P < 0.05, **P < 0.01.

