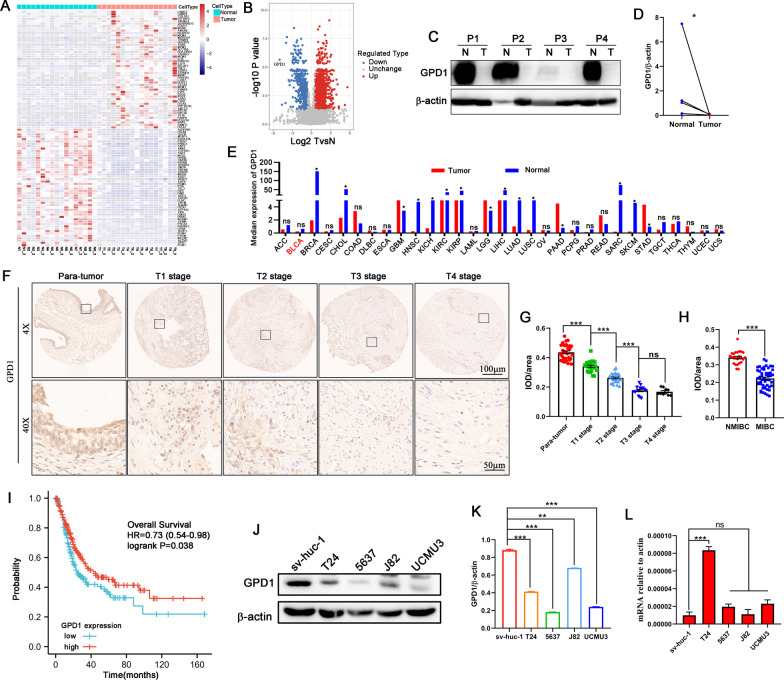
Fig. 1.
Proteomics reveals low expression of GPD1 in human bladder cancer tissues. A The heatmap shows significantly upregulated or downregulated proteins between bladder cancer tissues and matched adjacent normal tissues. B Volcano plot of differentially expressed proteins between bladder cancer tissues and matched adjacent normal tissues. C and D Western blotting to detect GPD1 expression in 4 paired normal and bladder tumor tissue. E GPD1 mRNA expression levels in 31 tumors and their paired normal tissues from TCGA database were analyzed by GEPIA tool. F–H Immunohistochemical examination of GPD1 expression in para-tumor tissue and different stage tumor tissue from patients with bladder cancer. Quantitative evaluation of GPD1 expression represented as IOD/area. I Kaplan–Meier plot for GPD1 gene expression to evaluate the probability of overall survival (OS). J and K Western blotting to detect GPD1 expression in different cell lines. Quantitation of the Western blotting data was performed by ImageJ. L RT-qPCR to detect GPD1 mRNA levels in different cell lines

