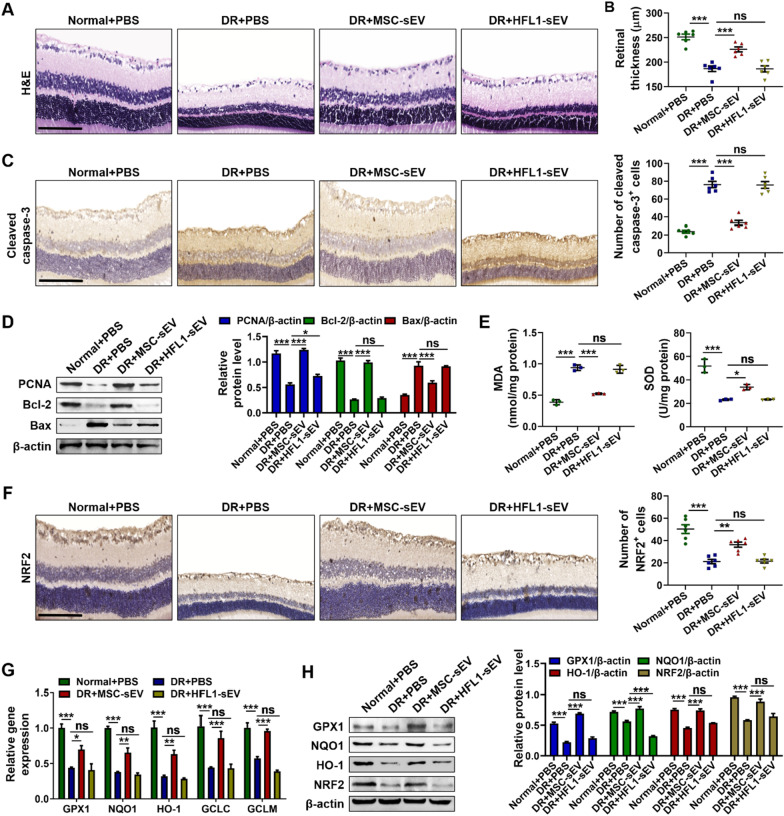
Fig. 2.
Retinal therapeutic effects of MSC-sEV on diabetic rats. A Representative retinal H&E staining images after treatment. Scale bars, 100 μm. B Retinal thickness analysis of each group (n = 6). C Representative images of immunohistochemistry staining of cleaved caspase-3. Scale bars, 100 μm. D Western blot analysis for the retinal expression of PCNA, Bcl-2 and Bax. E Retinal MDA and SOD levels measurement (n = 3). F Representative images of retinal immunohistochemistry staining of NRF2. Scale bars, 100 μm. G QRT-PCR for the relative mRNA levels of NRF2-related genes (n = 3). H Western blot analysis for the retinal expression of GPX1, NQO1, HO-1 and NRF2. All data are presented as means ± SEM. ns, not significant, *P < 0.05, **P < 0.01 and ***P < 0.001

