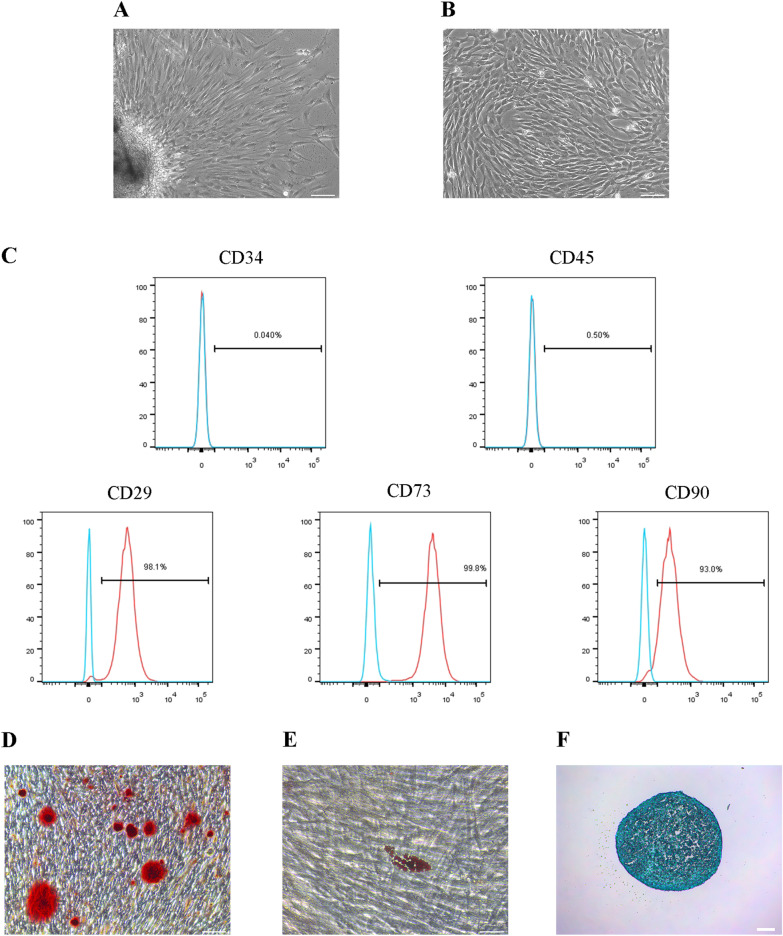
Fig. 1.
Cultivation and characterization of hDPSCs. A Primary hDPSCs at day 3. Scale bar = 100 μm. B hDPSCs at passage 3. Scale bar = 100 μm. C Flow cytometry analysis showing negative expression of CD34 and CD45 and positive expression of CD29, CD73 and CD90 in hDPSCs. D-F Multiple differentiations of hDPSCs. Alizarin red staining assayed osteo/odontogenic differentiation. Scale bar = 100 μm. Oil red O staining assayed adipogenic differentiation. Scale bar = 50 μm. Alcian blue staining assayed chondrogenic differentiation. Scale bar = 100 μm

