Fig. 1.
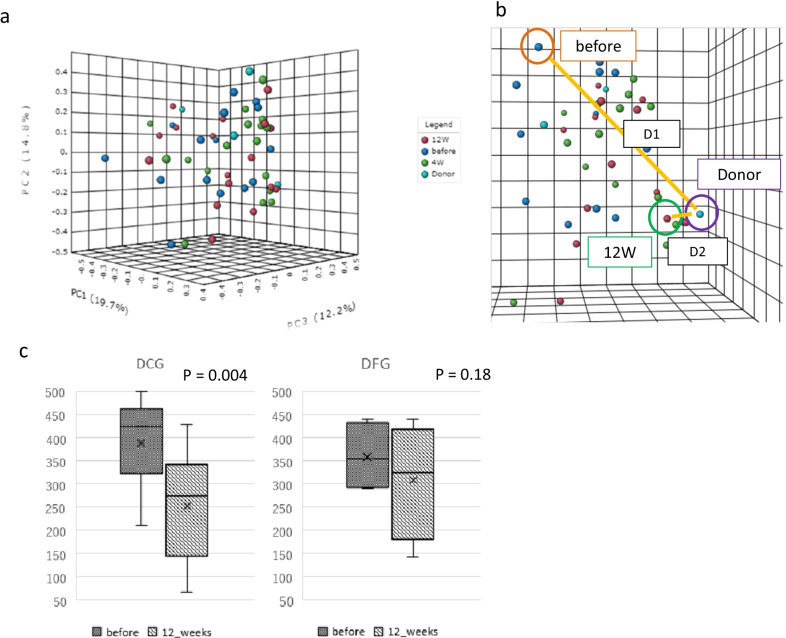
Principal coordinate analysis plot in donor and irritable bowel syndrome patients after fecal microbiota transplantation. a Principal Coordinate Analysis (PCoA) plot of patients (N = 17) with irritable bowel syndrome (IBS) and donors (N = 4). a, b Changes in patients’ microbiome were evaluated based on the distance traveled on the PCoA plot, as defined below. c Change of IBS severity index (IBS-SI) in patients classified as belonging to the Near Donnor Group (NCG, N = 13) and the Far Donor Group (FDG, N = 4) before and at 12 weeks after fecal microbiota transplantation (FMT)

