
Fig. 6. Variability due to Chair Selection.
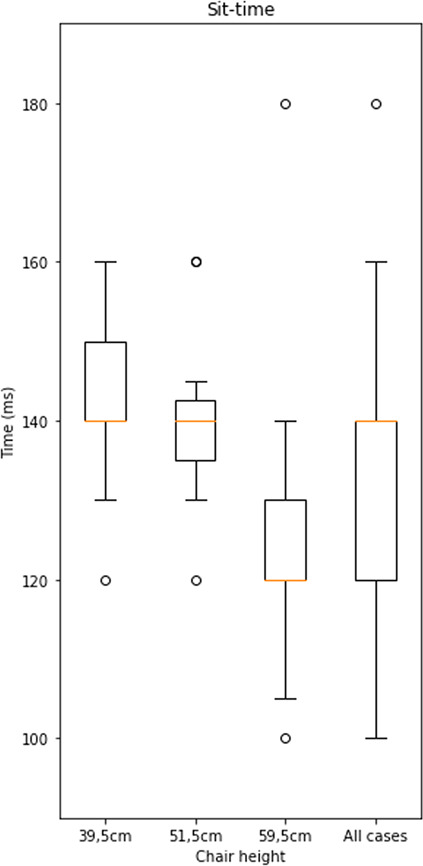
Chair height as a SoV for sit-to-stand transition time tests. Variability is considerably larger when considered across chairs. The error bars of boxplot are generated by matplotlib using the matplotlib.pyplot.boxplot function with default parameters. The boxplot extends from the first to the third quartile of the data with a line at the median. The whiskers extend from the box by 1.5 times the inter-quartile range.