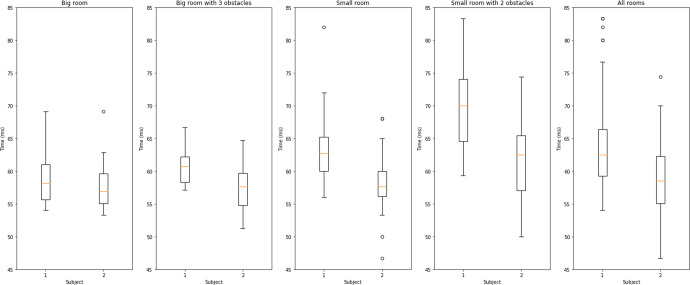
Fig. 7. Stride Time Variability.
Stride time variability arising from the home environment. The panels from left to right show box plots of passively recorded stride time for two subjects in four different settings and in aggregate. The error bars of boxplot are generated by matplotlib using the matplotlib.pyplot.boxplot function with default parameters. The boxplot extends from the first to the third quartile of the data with a line at the median. The whiskers extend from the box by 1.5 times the inter-quartile range.

