Figure 1.

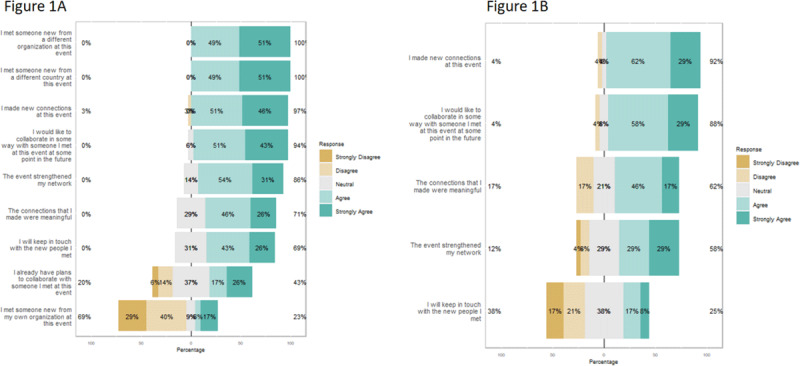
Bar plot summary of Likert scale responses in the inital (A) and follow-up (B) surveys to the perceived of the networks.

Bar plot summary of Likert scale responses in the inital (A) and follow-up (B) surveys to the perceived of the networks.