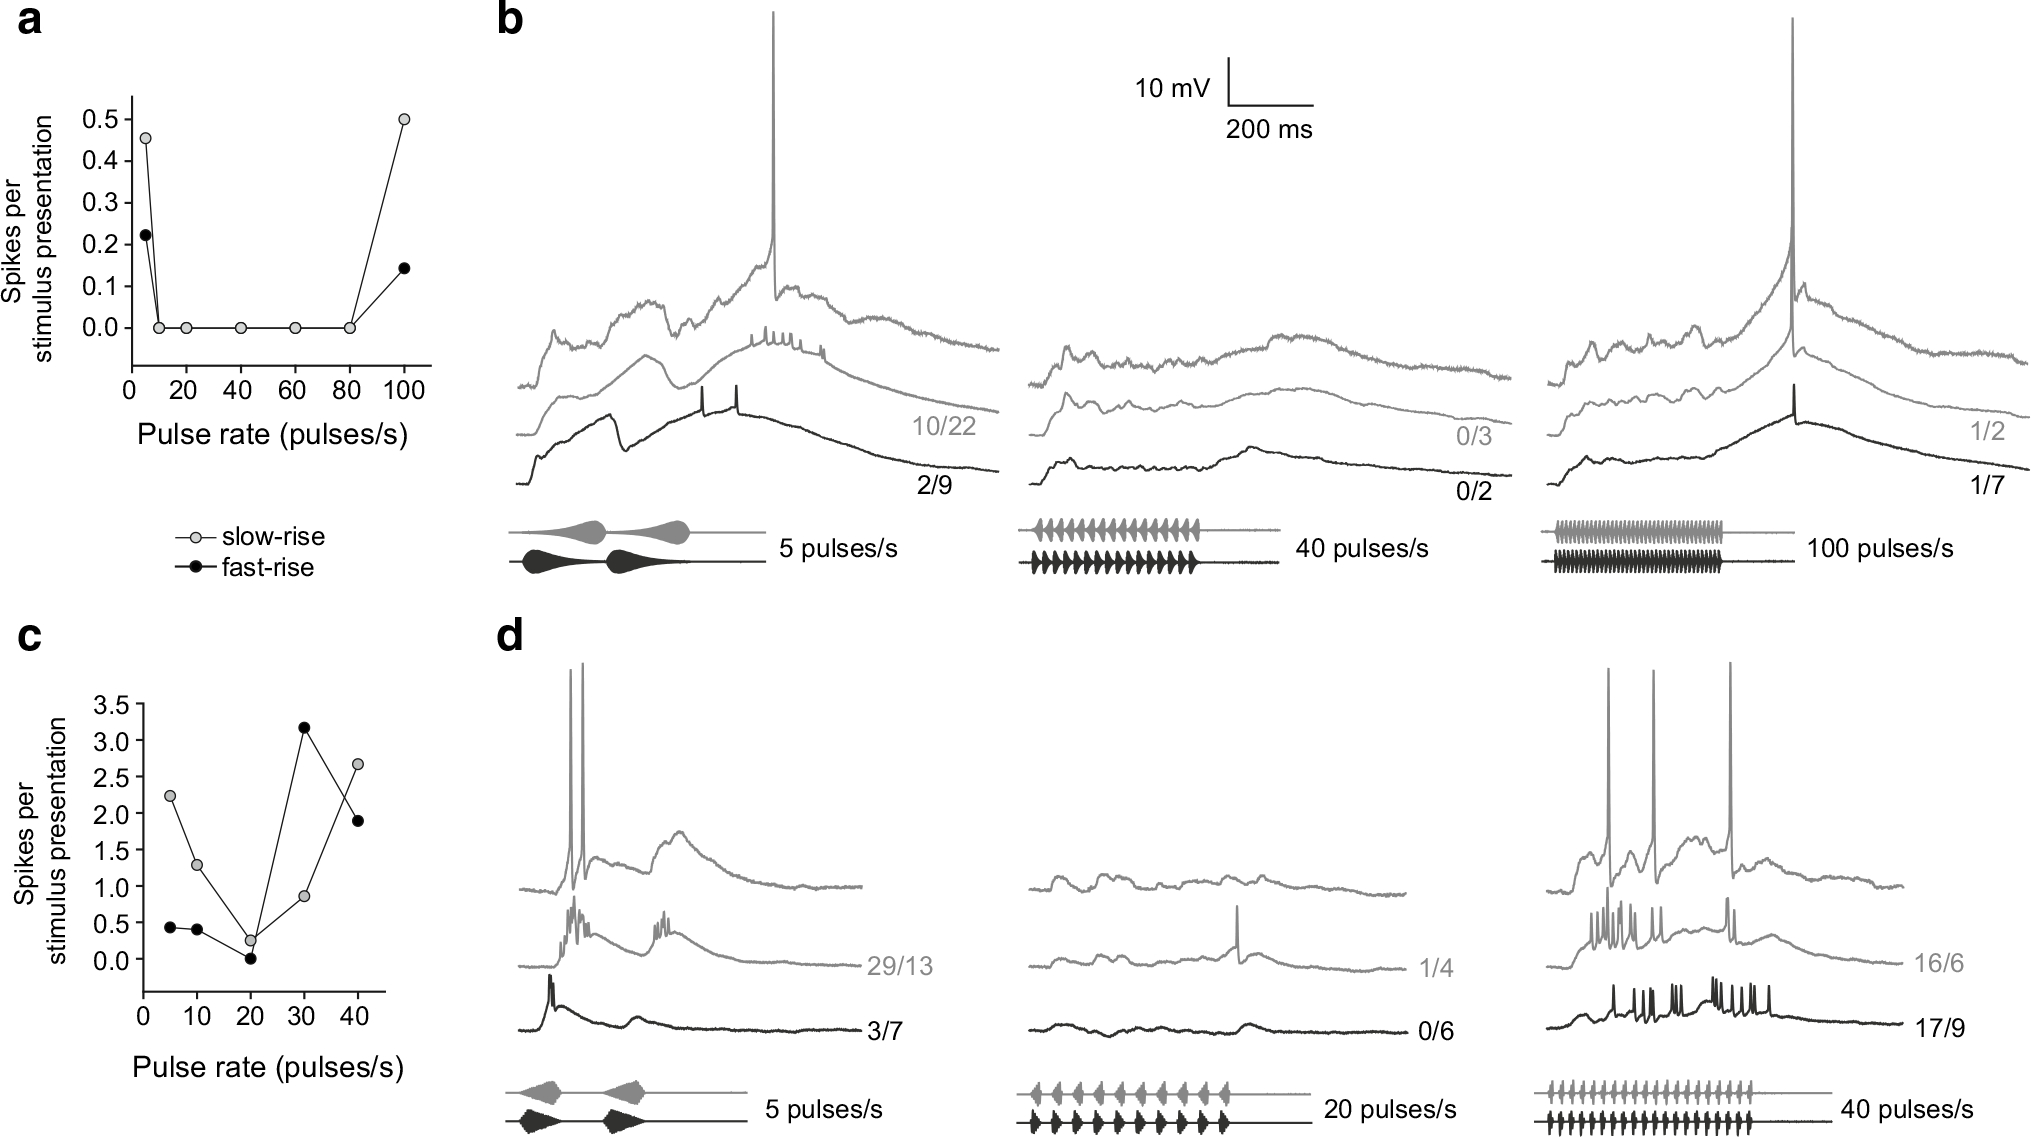
Fig. 9.

Pulse-rate selectivity functions (a, c) and whole-cell recordings (b, d) from band-suppression interval-counting neurons from H. versicolor and H. chrysoscelis, respectively. As in previous figures, upper traces in panels b and d are recordings of membrane potential responses to single presentations of the stimulus shown; other traces are averaged recordings. Responses to pulses that have slow-rise (80 %) or fast-rise (20 %) shape are shown in grey and black, respectively. Carrier frequencies (BEFs) = a 225 Hz, 81 dB SPL; c 275 Hz, 73 dB SPL
