Figure 1.
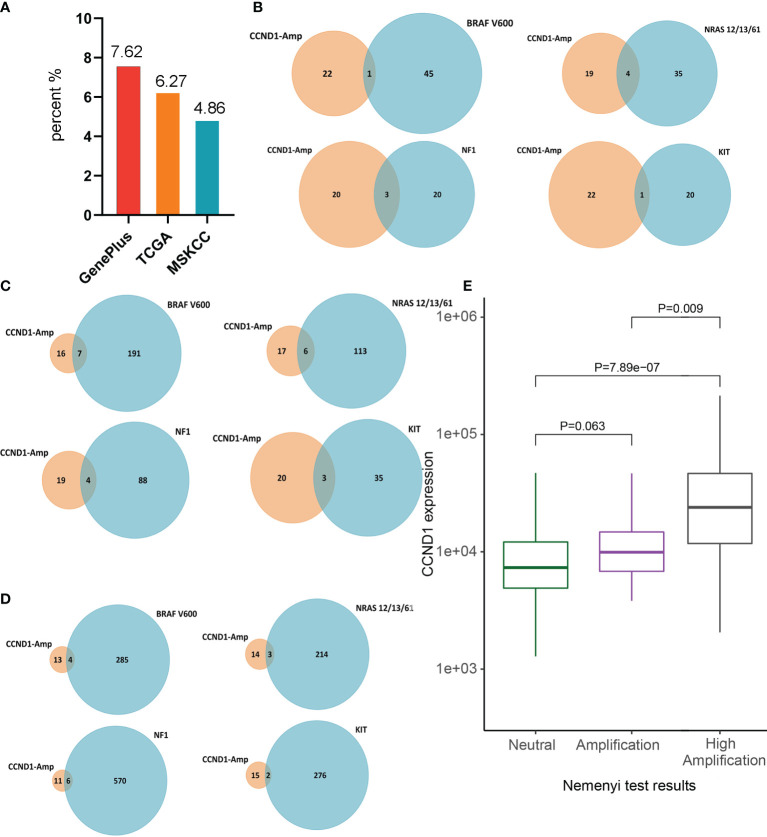
Prevalence of CCND1 amplification in melanoma. (A) The prevalence of CCND1 amplification calculated using data from Chinese patients with melanoma analyzed by Geneplus (n=302) and using data from the TCGA (n=367) and MSKCC (n=350) databases. (B) The frequency of co-occurrence of CCND1 amplification with BRAF V600, NRAS, NF1, KIT in samples from Chinese patients with melanoma analyzed by Geneplus. The frequency of co-occurrence of CCND1 amplification with BRAF V600, NRAS, NF1, KIT in samples from the (C) TCGA and (D) MSKCC databases. (E) CCND1 mRNA expression in the CCND1 Neutral group (n=191), Amplification group (n=46) and High Amplification group (n=23) in samples from the TCGA database. MSKCC, the Memorial Sloan Kettering Cancer Center; TCGA, The Cancer Genome Atlas.

