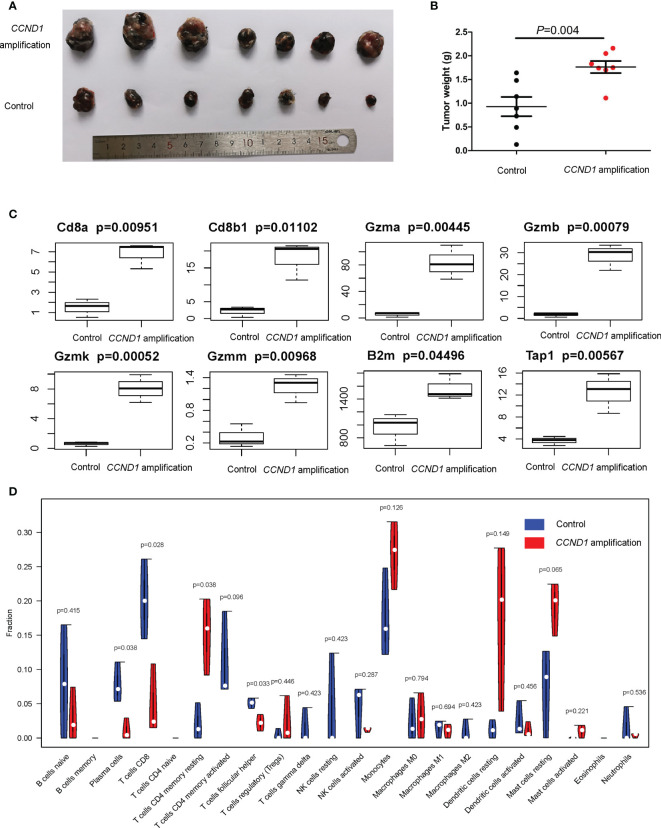
Figure 6.
Mice models of melanoma with CCND1 amplification interrogating the associated immune microenvironment. (A) Tumor appearance in each mouse was photographed. (B) The tumors were weighed 24 days after transplant. (C) Expression of CD8a, CD8b1, Gzma, Gzmb, Gzmk, Gzmm, B2m and Tap1 in CCND1 amplification tumor tissues and controls measured using RNA-seq (n=3), error bars represent ± standard deviation. (D) The relationship between CCND1 amplification status and immune infiltration of 22 immune cell subsets using the CIBERSORT (n=3).

