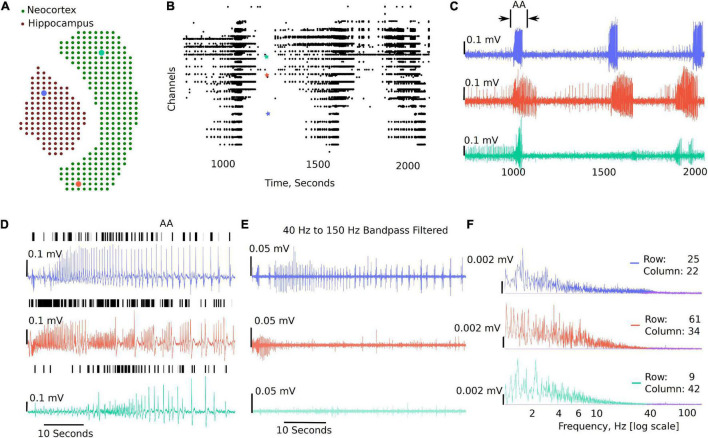
FIGURE 3.
Example visualizations generated from the GUI including raster plots, time-series traces, LFP activity peaks, and time frequency transformations. (A) 407 channels selected for this analysis representing the MEA sensor spatial array, covering both the neocortex and the hippocampal regions. (B) Raster plot for all the channels in the working file irrespective of brain regions for a selected time range, demonstrating time points of when the activity occurs in the slice. (C) Three selected traces: the blue trace from the hippocampal region, the red trace from one end of the neocortex, and the aqua trace from the other end of the neocortex. (D) Zoomed in view of the first seizure [the region bracketed in panel (C) as AA], with the black dashes showing a peak find function within the GUI. (E) This demonstrates the ability to plot filtered traces along with the raw traces. (F) The amplitude frequency transformations for the traces in panels (D,E) (band-pass filtered). The filtered FFT spectrum for each is shown in purple.

