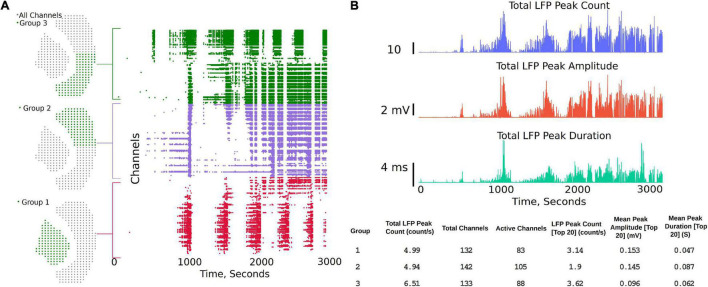
FIGURE 4.
Channel groups and raster plot can be generated to visualize LFP activity in different regions of the brain slice. (A) Sensor locations corresponding to three different regions selected for analysis and the region-specific raster plots. Group 1 being the hippocampus, while groups 2 and 3 each being one half of the Neocortex. (B) Summary plots and measures that can be generated within the analysis platform.

