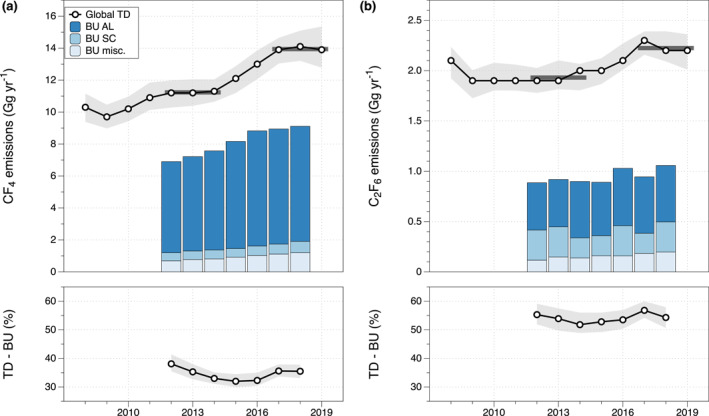
Figure 2.

Global top‐down and bottom‐up (BU) emissions of (a) CF4 and (b) C2F6, based on the Advanced Global Atmospheric Gases Experiment global 12‐box model with uncertainties representing the sixteenth and eighty fourth percentiles of the model distribution (Say et al., 2021) and BU data for the aluminum industry (IAI, 2020; Ottinger & Cai, 2019; Bogle & Ottinger, 2020), semiconductor industry (WSC, 2020), and other miscellaneous sources (Bogle & Ottinger, 2020), see Section 2 and Table A1 for details.
