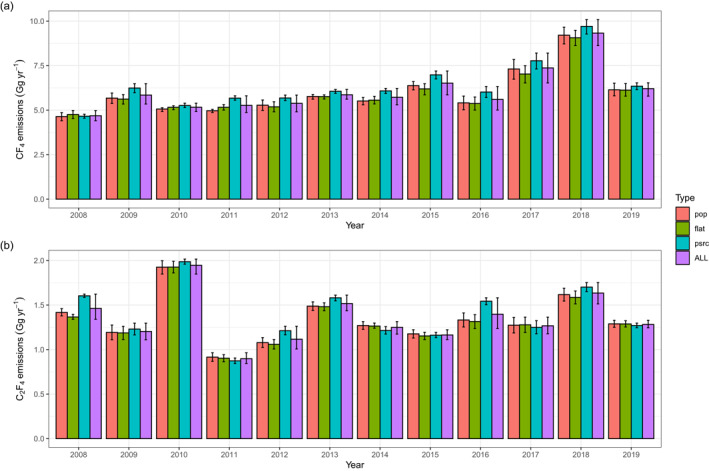
Figure 5.

Annual posterior results for (a) CF4 and (b) C2F6 by prior distribution type, namely population (“pop,” in red), flattened (“flat,” in green), and point source (“psrc,” in blue), as well as for all nine runs combined (“ALL,” in purple). The error bars represent the minimum and maximum values of the three model runs (base, high, low prior magnitudes in case) performed for each prior distribution or the nine model runs for a particular year.
