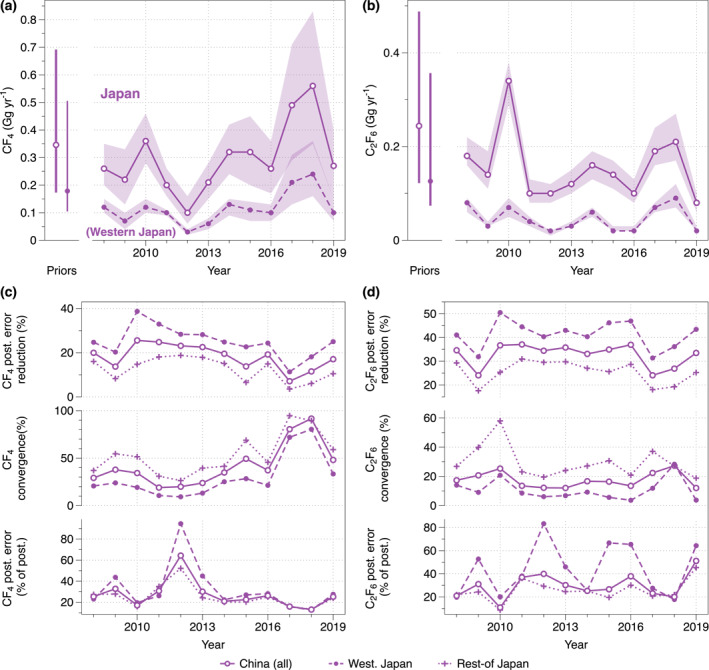
Figure 9.

Comparison of model posterior emissions and diagnostics for Japan (in solid lines and open circles), western Japan (dashed lines in filled circles; see Section 4.1 for the geopolitical definition), and rest of Japan (in dotted lines and plus symbol). The bars shown for the priors in (a and b) show the three prior magnitudes (“low,” “base,” and high”) tested in this study for Japan and western Japan (see Section 4 for details), and the uncertainty plotted on the posterior emissions are the range of results from the 9‐member inversion ensemble. Refer to Section 5.2 for definitions of the model diagnostics, and see Section 6 for detailed discussions of these results.
