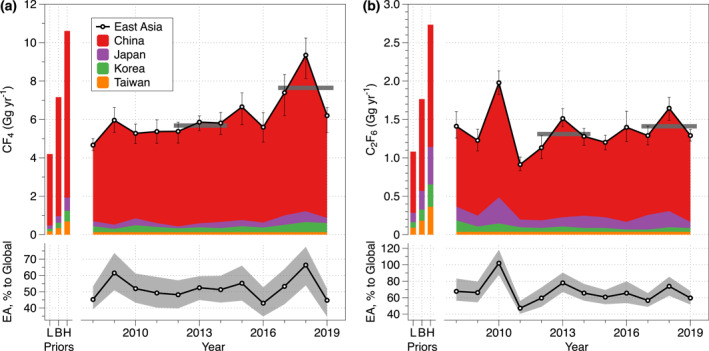
Figure 10.

Top‐down annual emissions of (a) CF4 and (b) C2F6 estimated for East Asia during 2008–2019 using the FLEXINVERT+ inversion framework. The top plot shows the prior and posterior emissions for China (red), Japan (purple), Korea (green), and Taiwan (orange), while the bottom plot shows the total East Asian emissions as a percentage of the total global top‐down emissions described in Section 2. The bars for the priors show the three prior magnitudes (“low,” “base,” and high”) tested in this study. The uncertainty bars on the posterior emissions are the range of results from the 9‐member inversion ensemble. The gray lines in the graph highlight the mean East Asian emissions for the periods of 2012–2014 and 2017–2019, respectively. Note that Taiwan's emissions are assumed to be constant, based on mean results from 2008, 2012–2013, and 2016–2019.
