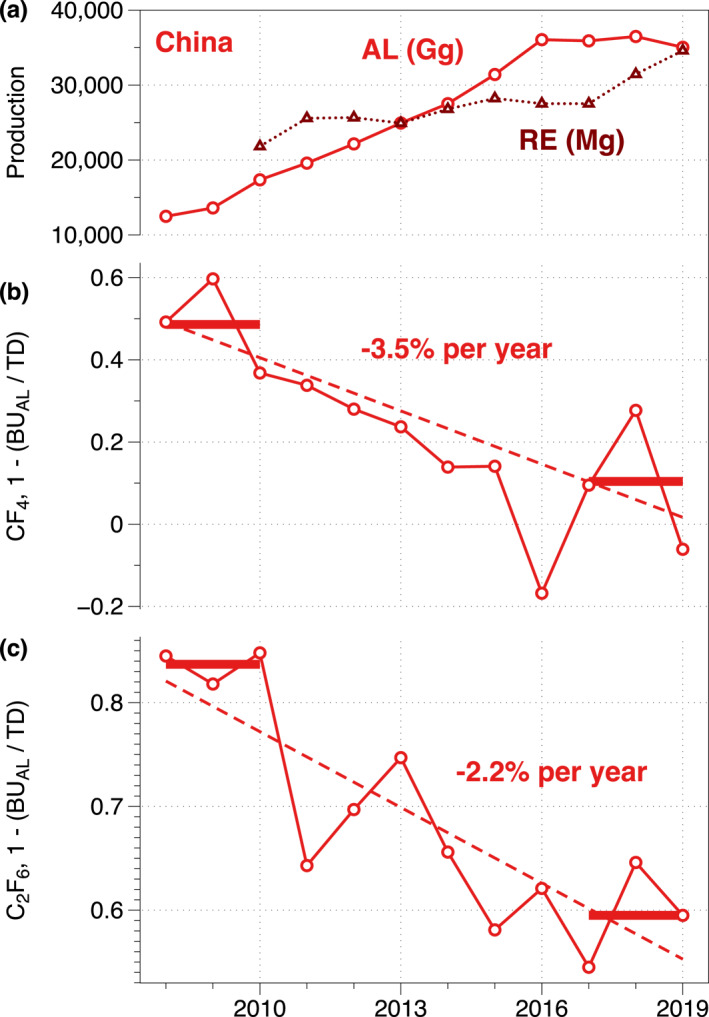
Figure 11.

(a) China's aluminum (AL) and rare earths (RE) production compared to the discrepancy between China's top‐down (TD) and AL industry bottom‐up emissions (BUAL) for (b) CF4 and (c) C2F6. Ideal agreement is achieved when 1‐(BUAL/TD) equals zero. Note the unit differences in production for AL (Gg) and RE (Mg) industries.
