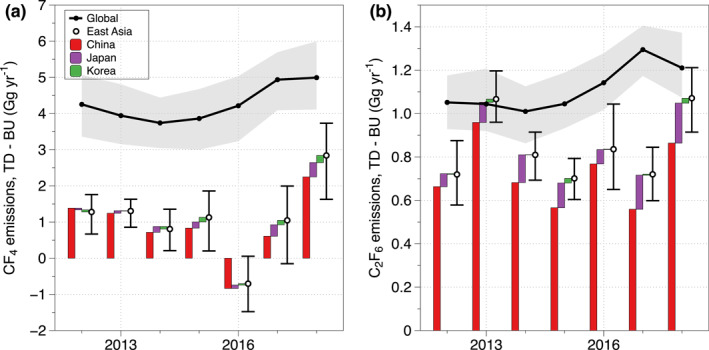
Figure 13.

Emission differences between top‐down (TD) and bottom‐up estimates globally (black line) and for East Asia (totals in black dot, with a break‐up of China (red), Japan (purple), and Korea (green) as offset stacked bars) for (a) CF4 and (b) C2F6. Error bars represent uncertainties in the TD only and underestimate the total uncertainties in this comparison. Note that the regional discrepancy in some years is negative. See discussions in Section 5.4 for details.
