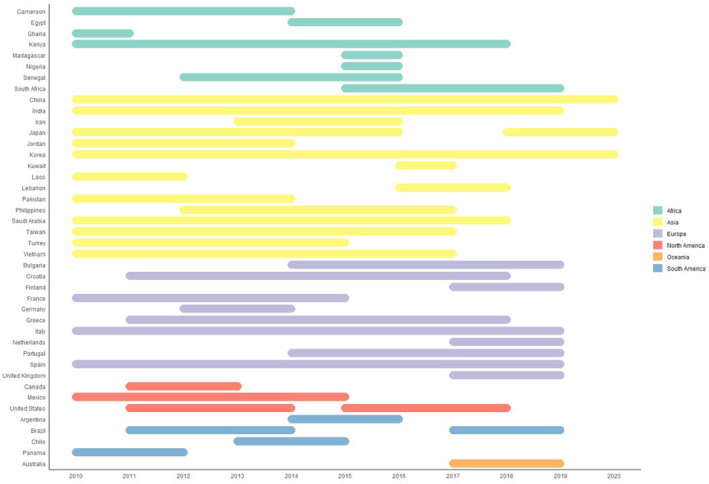
FIGURE 5.

Temporal distribution of recent sequences. The bars show the time period of sample collection. Countries included in this review are shown on the y‐axis. The time line from 2010–2020 is shown on the x‐axis. The continents are coloured according to the legend
