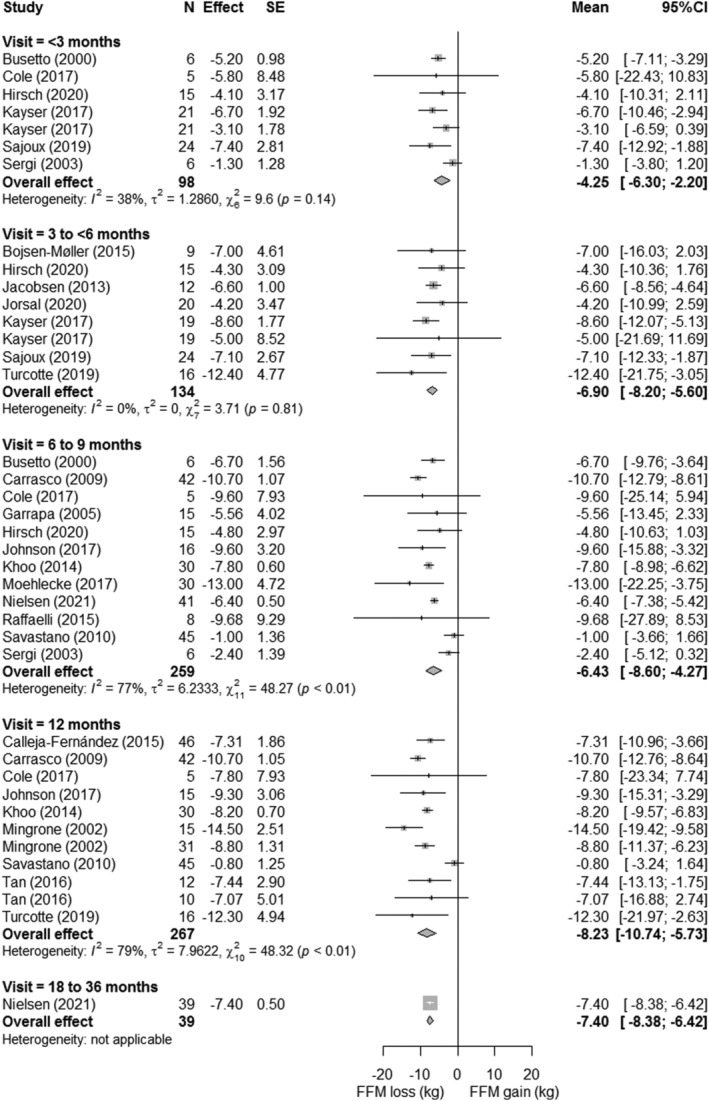
FIGURE 4.

Forest plots of fat‐free mass loss with respect to preoperative measures. The effect size (mean difference between preoperative and postoperative measure) and 95% confidence interval for individual studies and the pooled estimate per time point are depicted. Mean follow‐up time was 1.5 ± 0.8 months for <3 months, 3.3 ± 0.7 months for 3 to 6 months, 6 ± 0 months for 6 to 9 months, 12 ± 0 months for 12 months, and 18 ± 0 months for 18 to 36 months
