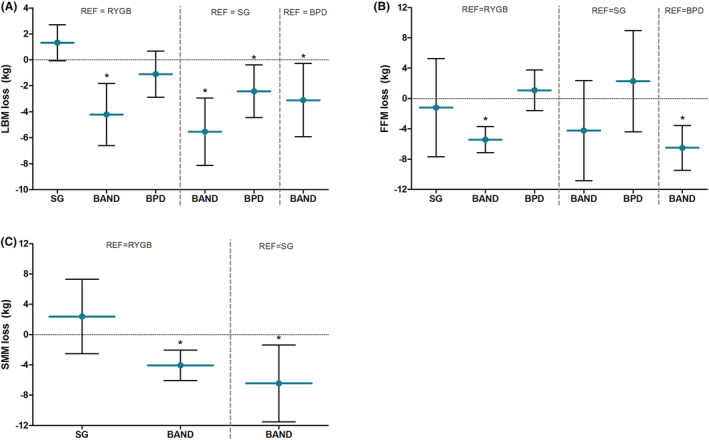
FIGURE 6.

Differences in lean body mass loss (A), fat‐free mass loss (B), and skeletal muscle mass loss (C) in kilograms between bariatric procedures adjusted for time‐effects. Blue horizontal lines reflect the mean difference with respect to the reference group, and the error bars reflect the corresponding lower and upper limit of the 95%CI. A positive value on the y‐axis reflects a greater loss compared with the reference group, whereas a negative value reflects a smaller loss than the reference group. BAND, adjustable gastric band operation; BPD, biliopancreatic diversion; RYGB, Roux‐en‐Y Gastric bypass; SG, sleeve gastrectomy; * P < 0.05 with respect to reference group
