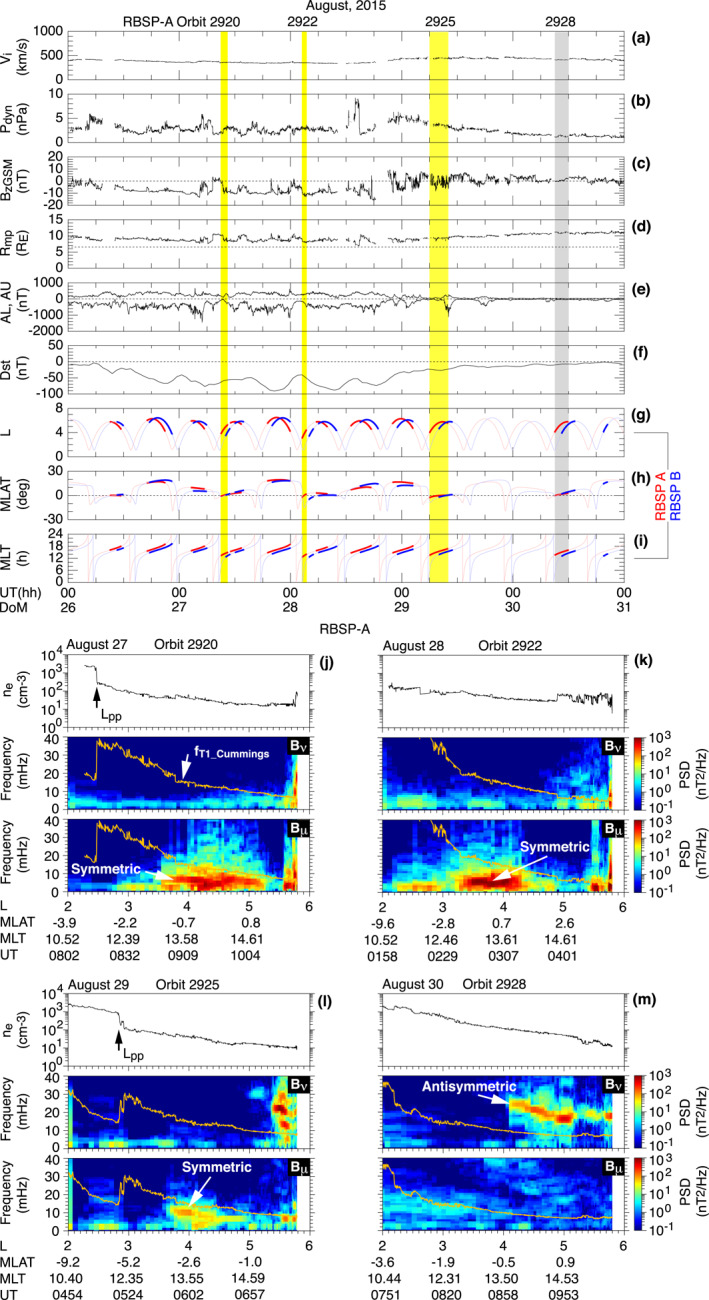
Figure 2.

Overview of observation of ULF waves by RBSP A and B on August 26–30, 2015. (a–c) Solar wind parameters selected from the OMNI data. (d) Magnetopause standoff distance according to Shue et al. (1998). The horizontal dashed line indicates the maximum L (6.5) reached by the RBSP spacecraft. (e, f) Geomagnetic activity indices. (g–i) Dipole coordinates of RBSP A (red) and B (blue). The colored thick portion of the coordinate plots indicates detection of poloidal Pc4–5 waves. The yellow or gray shading highlights observations by RBSP A near the magnetic equator on its outbound orbit legs. (j–m) Electron number density and the power spectra of the B ν and B μ components on the four highlighted orbit legs of RBSP A, plotted as a function of L. The power spectra are computed using a 15‐min data window, which is moved forward in 2.5 min steps. The orange traces in the bottom two panels labeled f T1_Cummings indicate the model fundamental toroidal wave frequency described in Section 4.2.
