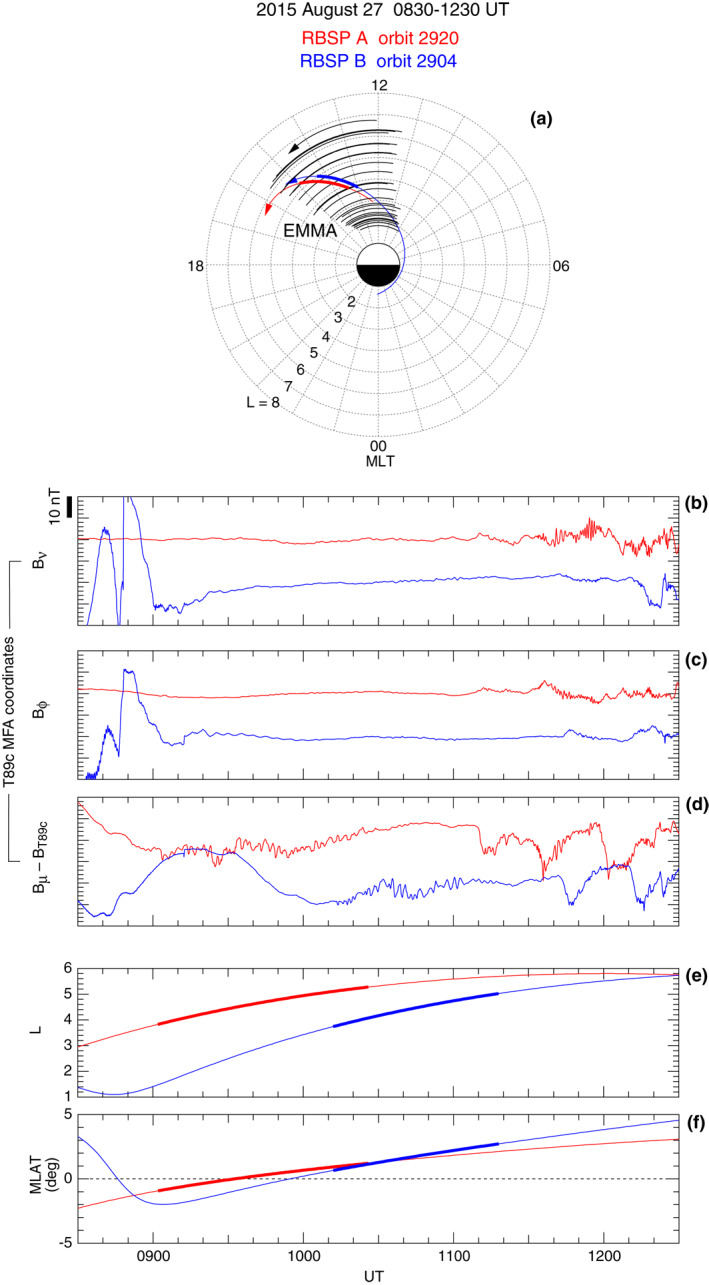
Figure 3.

Magnetic field observation by RBSP A (red traces) and B (blue traces) at 0830–1230 UT on August 27, 2015. (a) Observatory positions in L‐MLT coordinates. The thick portions of the RBSP orbits indicate detection of compressional Pc4–5 oscillations. The black arcs indicate the 24 EMMA stations. (b)–(d) Magnetic field components in the local MFA coordinate system based on the T89c model field (Tsyganenko, 1989). Vertical offsets are added to separate data from the two spacecraft. (e, f) L and MLAT of the spacecraft. The heavy portion of the line plots indicates the time interval of the compressional Pc4–5 oscillations discussed in the text.
