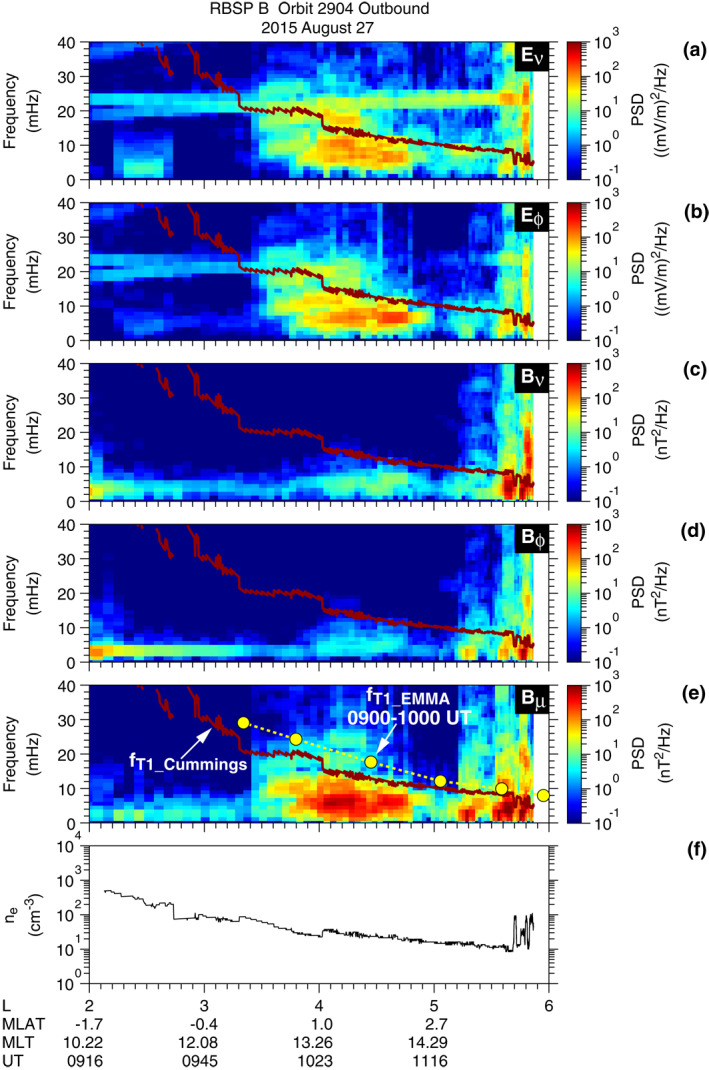
Figure 4.

(a)–(e) L versus frequency plots of the power spectral density of the full E‐field and B‐ field components at RBSP B on the outbound leg of orbit 2904. f T1_Cummings is plotted in brown in each panel. The yellow filled circles in panel (e) indicate the fundamental toroidal wave frequency obtained using the cross‐phase analysis of EMMA data. They are plotted as a function of the L value of the EMMA stations defined using the T02 model. (f) Electron density.
