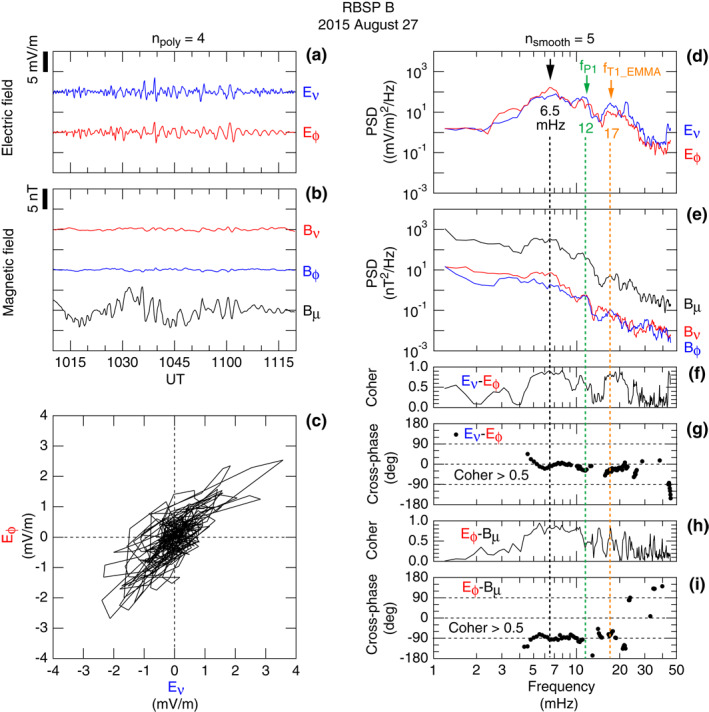
Figure 5.

Time and frequency domain properties of compressional waves detected at RBSP B at 1010–1220 UT on August 27, 2015. The time series is detrended by subtraction of a polynomial as described in the text. The spectra are smoothed by 5‐point averaging. (a) Detrended electric field. (b) Detrended magnetic field. (c) Electric field hodogram. (d) Power spectra of the electric field components. The highest peak occurs at 6.5 mHz and is marked by a black dashed line. The orange dashed line marks the frequency (17 mHz) of another spectral peak found in multiple field components, which coincides with f T1_EMMA shown in Figure 4e. The fundamental poloidal wave frequency f P1 (= 12 mHz) is estimated by multiplying f T1_EMMA by the theoretical ratio f P1/f T1 ∼0.7 (Cummings et al., 1969). (e) Power spectra of the magnetic field components. (f, g) Coherence and cross‐phase spectra computed from the E ν and E ϕ time series. (h, i) Coherence and cross‐phase spectra computed from the E ϕ and B μ time series.
