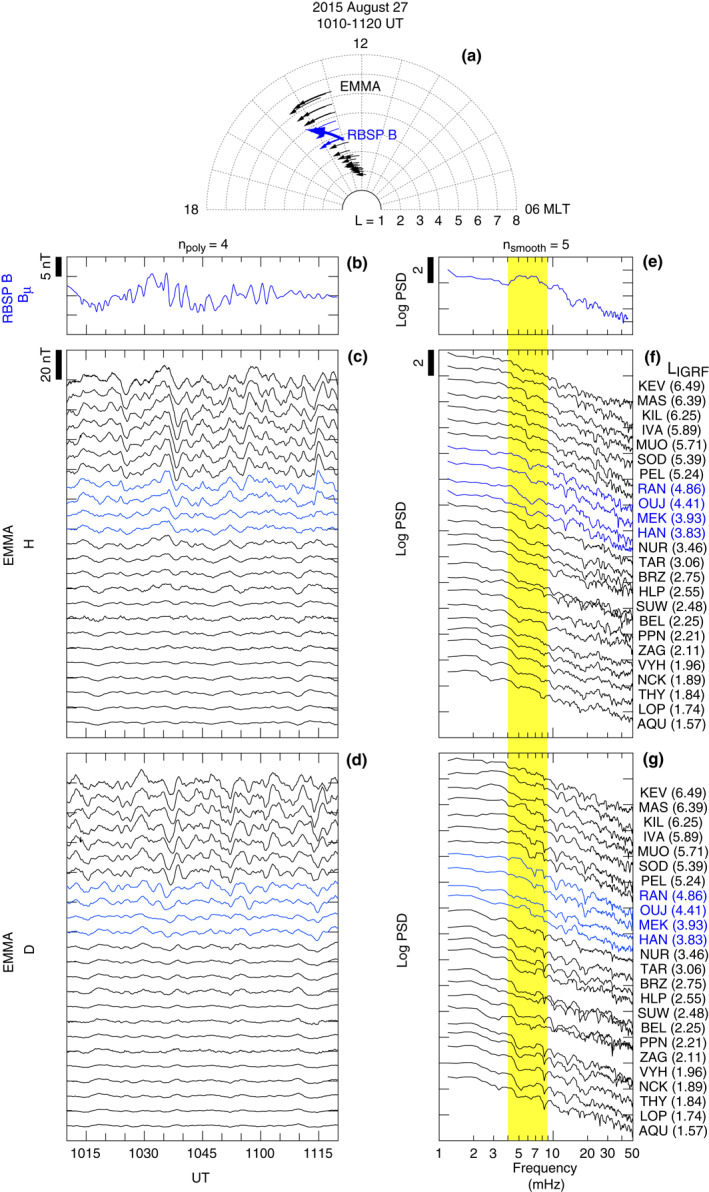
Figure 6.

Comparison of compressional magnetic field oscillations at RBSP B and ground magnetic field oscillations at EMMA. EMMA data for the L range (3.7–5.0) of the waves observed by RBSP B are shown in blue. (a) Locations of the spacecraft and EMMA magnetometers for the selected time interval 1010–1120 UT on August 27, 2015. (b)–(d) Magnetic field time series for (b) RBSP B, (c) EMMA station H component, (d) and EMMA station D component. (e)–(g) Power spectra computed from the detrended time series. The station code and L value of the EMMA stations are shown on the right of the spectrum stack plots.
