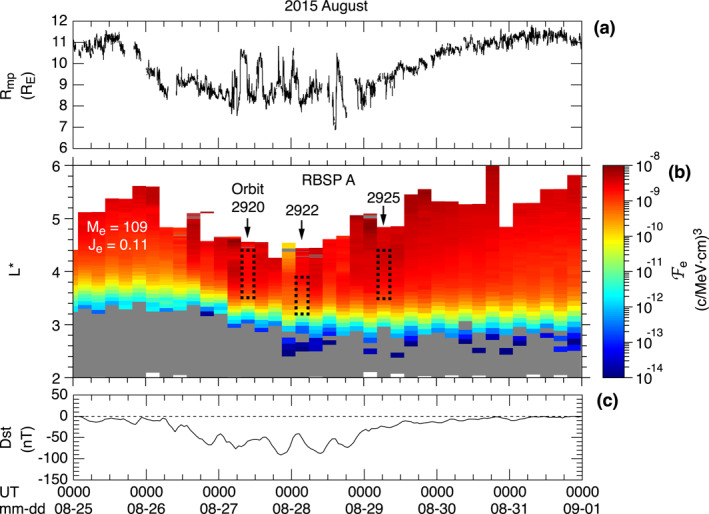
Figure 10.

Overview of the relationship between electron phase space density and symmetric waves. (a) Magnetopause standoff distance according to Shue et al. (1998). The solar wind OMNI data are used as input. (b) Electron phase space density at RBSP A evaluated for M e = 109 MeV/G and J e = 0.11 R EG1/2 and plotted as a function of time and L*. Each pixel covers a half orbit (4.5 hr) along the time axis. The rectangles drawn with black dotted lines indicate the symmetric compressional waves identified in Figure 2. (c) Dst index.
